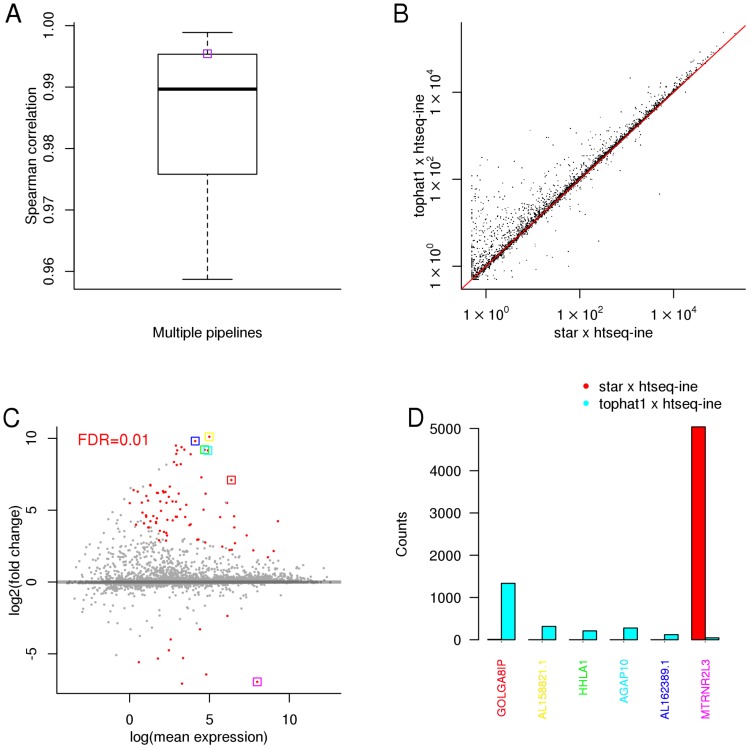
Figure 2. Illumina body map (E-MTAB-513) - RNA-seq data from Human.
A) Spearman correlation distribution between the gene expression profiles inferred by different pipelines; B) correlation between two specific pipelines (the respective Spearman correlation is shown in plot A as a purple box); C) fold change between the gene expression values inferred by the same two pipelines - dots in red denote genes where the expression values are significantly different between the two selected pipelines (for a false discovery rate of  ); D) read counts inferred by the two pipelines for the six selected (boxed) genes in plot C).

