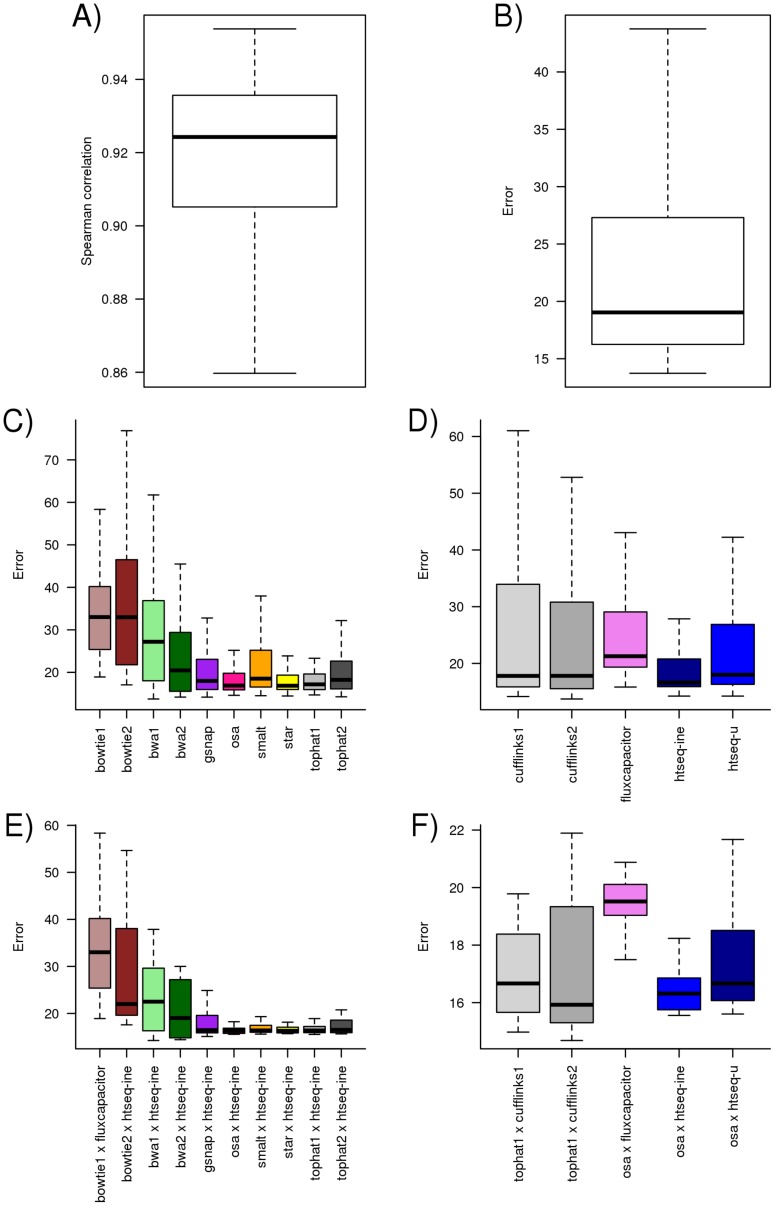
Figure 3. Distribution of Spearman correlation (A) and error (B) observed across all 32 data sets and all pipelines.
Each observation corresponds to the value computed using a pipeline on a specific data set. The distribution of the error across all data sets and pipelines segmented by aligner (C) and quantification method (D). The distribution of the error across all data sets for the pipeline with lowest error for each aligner (E) and quantification method (F).

