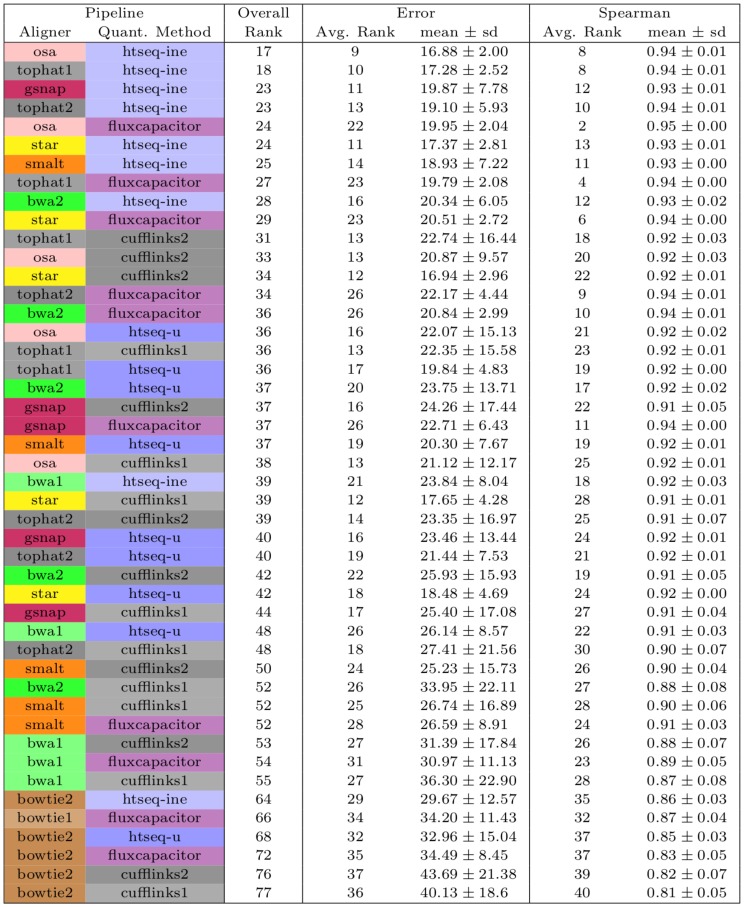
Figure 4. Average rankings of the pipelines observed on the 32 data sets using two metrics (relative error and Spearman correlation).
The overall rank was obtained by summing the average rank (N = 32) obtained on each metric. The average value and standard deviation across data sets is shown for each metric. The pipelines are sorted by overall rank.

