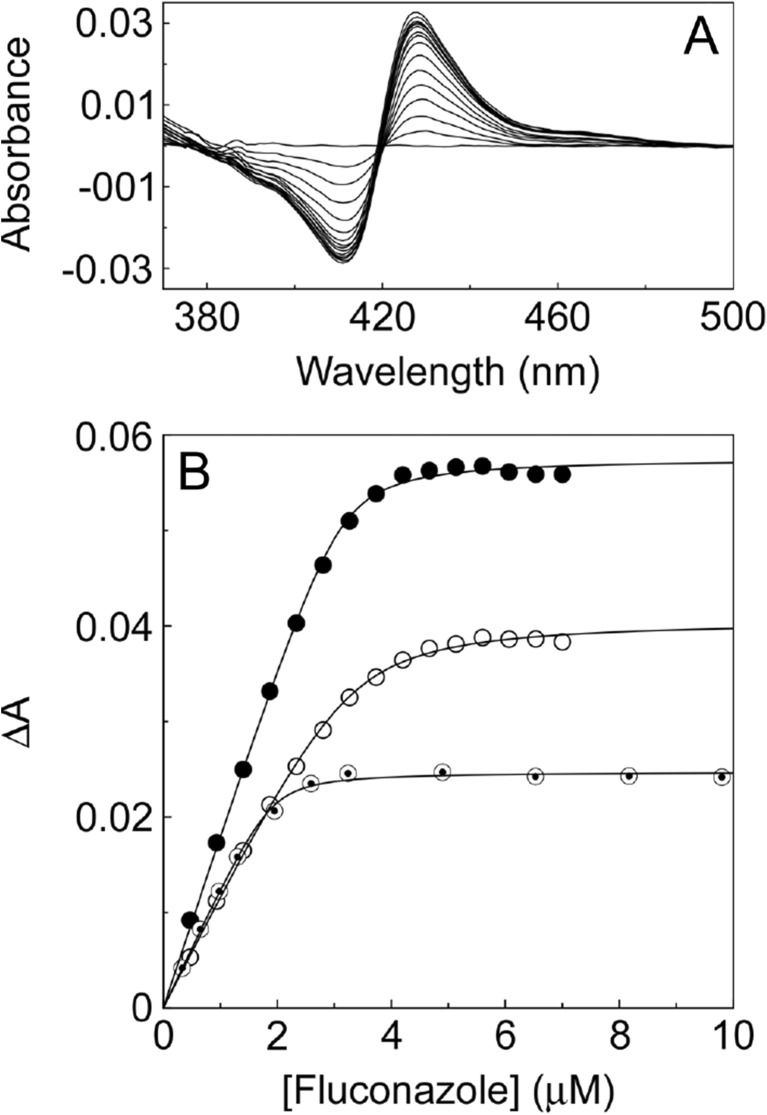
Fig. 4.
Fluconazole binding studies with wild-type, S279F and I471T C. albicans CYP51 proteins. The type II difference spectrum obtained for the wild-type protein is shown a along with the fluconazole saturation plots b for wild-type (black circle), S279F (white circle) and I471T (◉) C. albicans CYP51. A rearrangement of the Morrison equation [172] was used to fit the data and determine K d values

