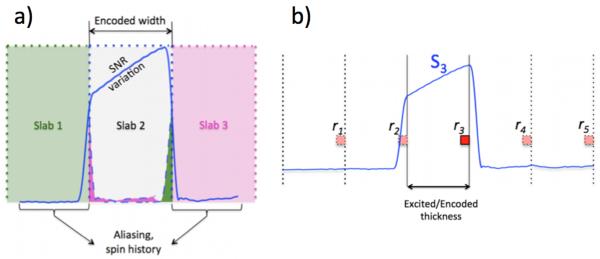
Fig. 1.
a) Venetian blind artifact. The solid blue line represents the slab excitation profile. Extension of slab profile beyond the desired slab thickness, which is also the encoded width, causes aliasing (shaded pink and green areas) and spin history effects. Magnitude variation of the excitation profile within the main lobe causes magnitude variation in the reconstructed image. b) A multislab acquisition. The solid blue curve shows the profile of the acquired slab S3. The encoded thickness was equal to the excited slab thickness. The red-filled square with solid border represents an acquired voxel. Because the achieved slab profile (blue curve) extended beyond the encoded slab thickness, the signal in the acquired voxel (red) contains signals from voxels that are at multiple encoded thicknesses away (aliasing).

