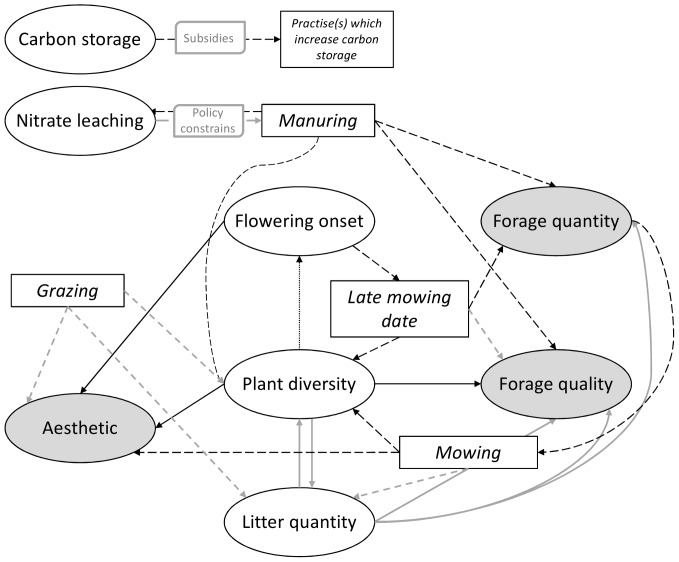
Figure 2. Farmers' ecosystem services values and knowledge.
Conceptual representation based on farmers' discourses on values and knowledge about the relationship between ES and land-management practices. Rectangle boxes indicate practices and ellipses indicate ES. Dashed arrows indicate links between practices and ES and plain arrows indicate links between ES. Grey arrows indicate a negative effect and black arrows a positive effect. Except for the effect of litter quantity on forage quantity, farmers agree on all the relationships. Note that ES in grey are seen as final ES by farmers while the others are considered as intermediate ES [40].

