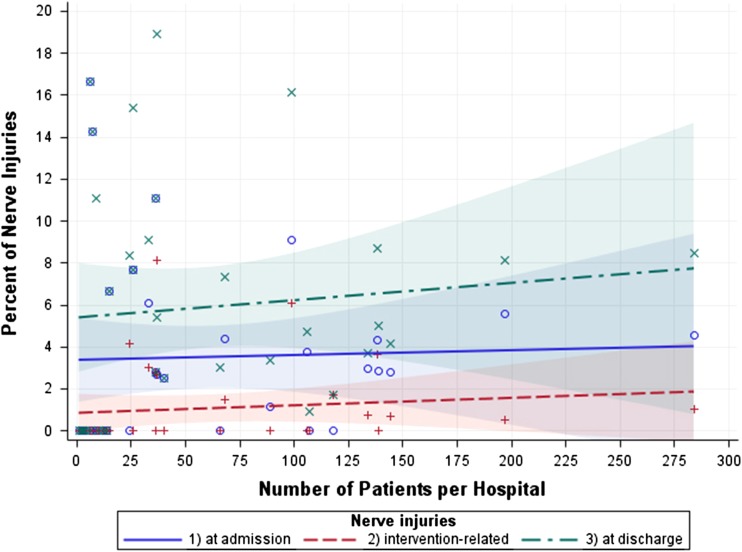
Fig. 1.
The figure displays relationships between the number of treated patients per hospital and the frequencies of nerve injuries at admission, at discharge, and intervention-related nerve injuries. Incidences of nerve injuries for each participating hospital are coded as o (on admission), + (intervention related), and X (at discharge).

