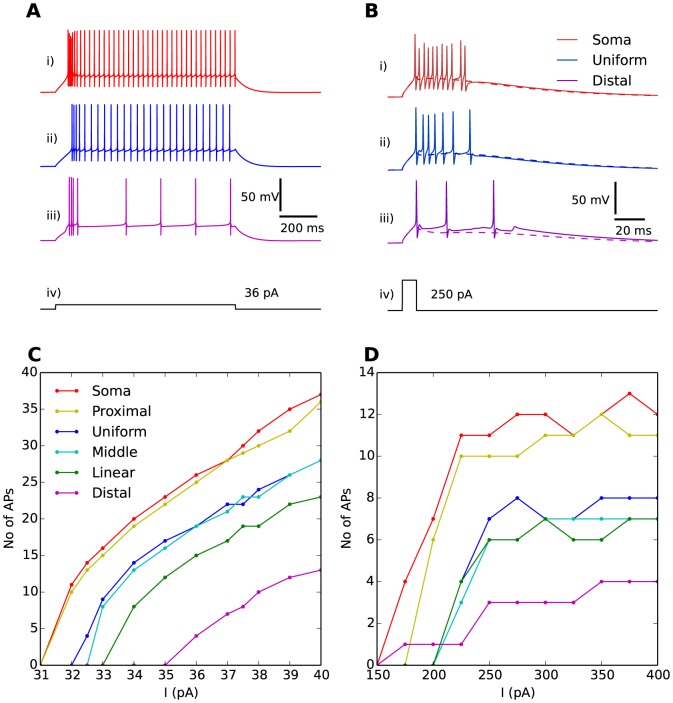
Figure 2. Response to somatic current injection.
(A) A prolonged (1000 ms) stimulus protocol,  (A-iv), evoked an initial high AP-firing frequency phase, followed by a series of regularly spaced APs. (B) A brief (10 ms) stimulus protocol,
  (B-iv), evoked a burst of APs. When AP firing was suppressed by setting the Na+-conductance to 0, the Ca2+-spike underlying the burst was revealed (dashed lines). The somatic response for three distributions are shown: the soma distribution (A-i, B-i), the uniform distribution (A-ii, B-ii), and the distal distribution (A-iii, B-iii). (C) Number of regular APs elicited during the last 700 ms of the stimulus period as a function of prolonged stimulus amplitude (
 ) for all T-distributions. The regular AP-firing rate was facilitated by having T-channels in the proximity of the soma. (D) Number of APs elicited in bursts as a function of brief stimulus amplitude (
 ) for all T-distributions. The bursting propensity was facilitated by having T-channels in the proximity of the soma.

