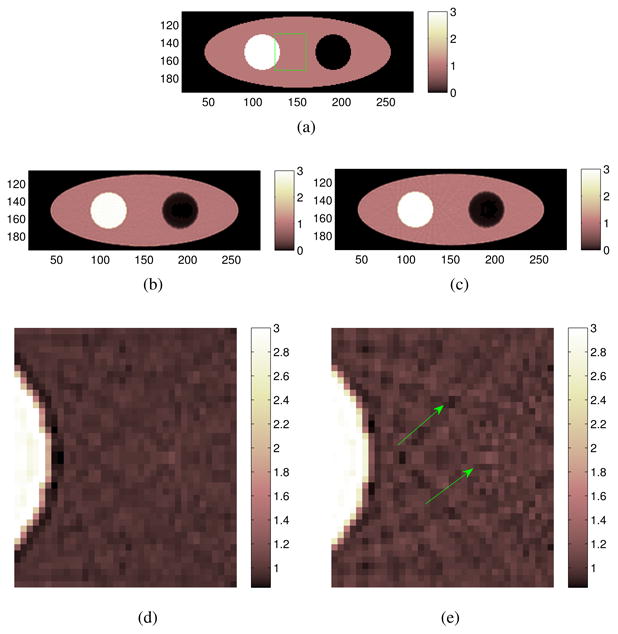
Figure 4.

Comparison of image reconstruction using a matched and an unmatched image blurring matrix. (a) The simulated phantom image which consists of a warm background, a hot region and a cold region; (b) reconstructed image using the matched image blurring matrix; (c) reconstructed image using the unmatched image blurring matrix. (d) and (e) are zoom-in images corresponding to (b) and (c), respectively. The zoom-in area is marked by the rectangle in (a). The arrows in (e) point to the artifacts which are more pronounced than those in (d).
