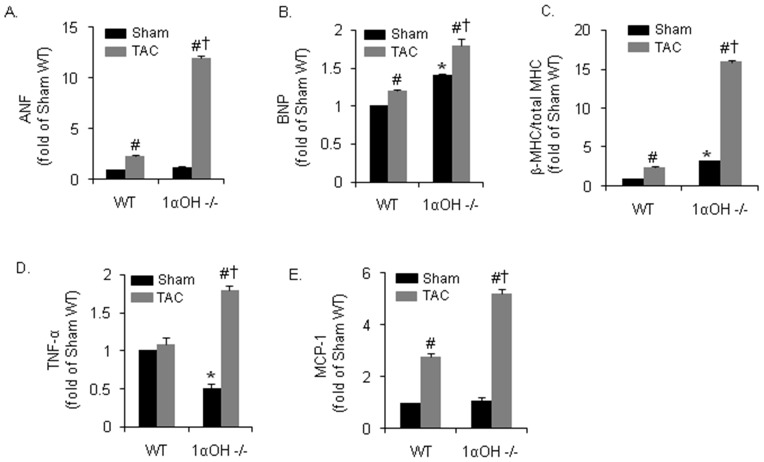
Figure 3. Biochemical findings after 4 weeks of Pressure overload in 1αOHase−/− mice.
(A–C) Real-time PCR mRNA expression of ANF (A), BNP (B) and of ß-MHC to total MHC ratio (C) in WT and 1α-OHase−/− mice after 4 weeks of sham or TAC. *, p<0.05 compared to WT. #, p<0.05 compared to sham. †, p<0.05 compared to WT TAC. N = 8–10. (D and E) Real-time PCR mRNA expression of inflammatory cytokines TNF-α (D) and MCP-1 (E) in WT and 1α-OHase -/- mice after 4 weeks of sham or TAC. *, p<0.05 compared to WT. #, p<0.05 compared to sham. †, p<0.05 compared to WT TAC. N = 8–10.

