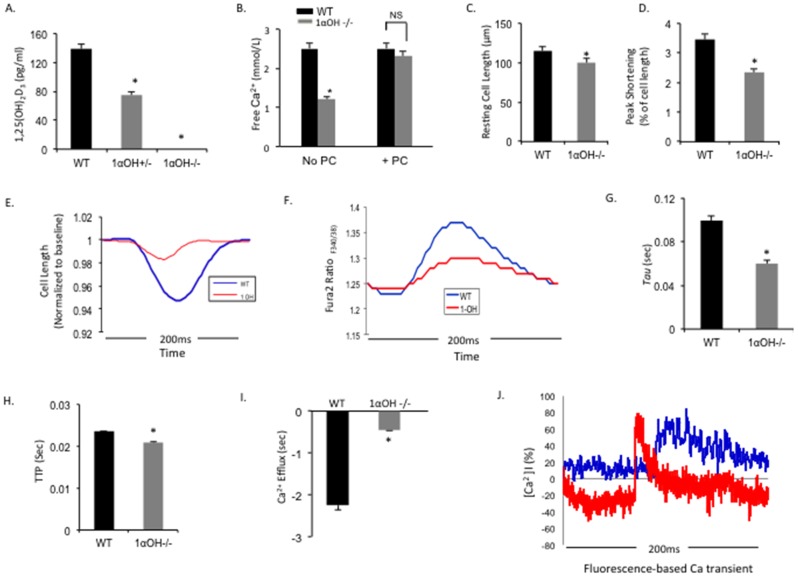
Figure 4. Contractile function and Ca2+ transient parameters in isolated CMs from 1αOHase −/− mice.
(A and B) Baseline 1, 25(OH)2D3 (A) and free Ca2+ (B) level in WT and 1αOHase −/− mice serums. *, p<0.05 compared to WT, N = 6–8 mice. (C) Resting cell length (D) and peak shortening (% of cell length) from isolated CMs obtained from WT and 1αOHase −/− mice. *, p<0.05 compared to WT. Ten twitches per CMs were collected for each mouse heart. N = 6–8 mice/group. (E) Continuous measurement of cell contractility from isolated CMs obtained from WT (blue line) and 1αOHase−/− (red line) mice. *, p<0.05 compared to WT. Ten twitches per CMs were collected for each mouse heart. N = 6–8 mice/group. (F) Representative Fura 2 ratio (F340/380) from isolated CMs obtained from WT (blue line) and 1αOHase -/- (red line) mice. Data shows that the twitch peak amplitudes are significantly different between WT and 1αOHase -/- CMs, which indicate severely defective Ca2+ handling in 1αOHase−/− CMs. (G–I) The rate of Ca2+ transient decay (Tau) (G), time to peak contraction (TTP) (H), and return velocity to baseline or Ca2+ efflux in WT and 1αOHase−/− CMs. *, p<0.05 compared to WT. N = 10 CMs/mouse heart. N = 6–8 mice/group. (J) Representative traces of Ca2+ transients evoked by 10 mM caffeine recorded in WT (blue line) and 1αOHase−/− (red line) mice CMs.

