
Figure 5. The retinal-binding pocket and the proton-release pathway in cR3.
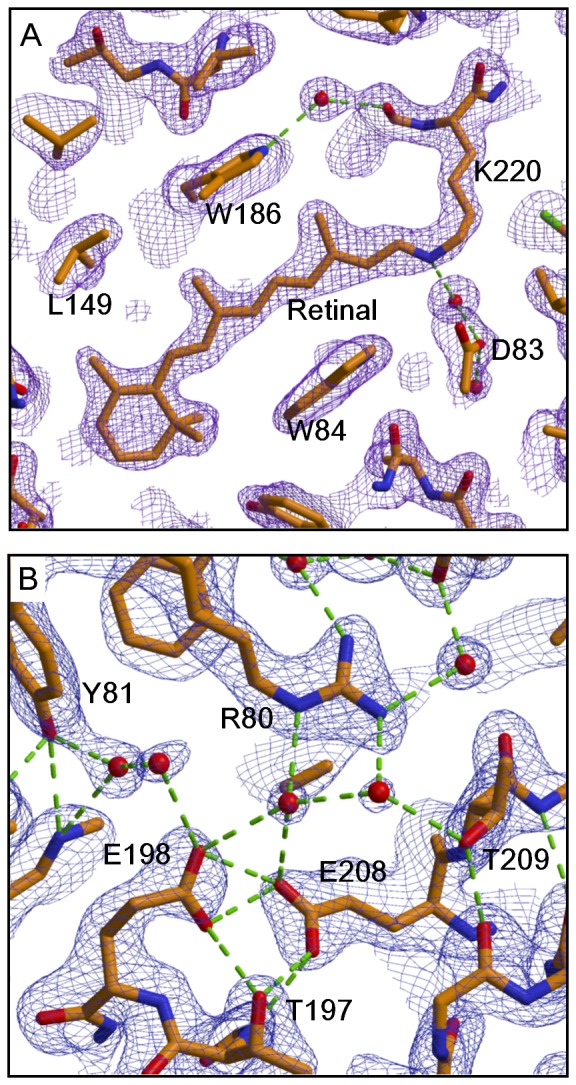
The 2F o-F c maps around the retinal-Lys216 chain (A) and the proton-release group (B), contoured at 1 σ and overlaid on the structural model. Carbon, oxygen and nitrogen atoms are drawn in green, red and blue, respectively.