
Figure 3. Hyperglycaemia did not affect mitochondrial membrane potential.
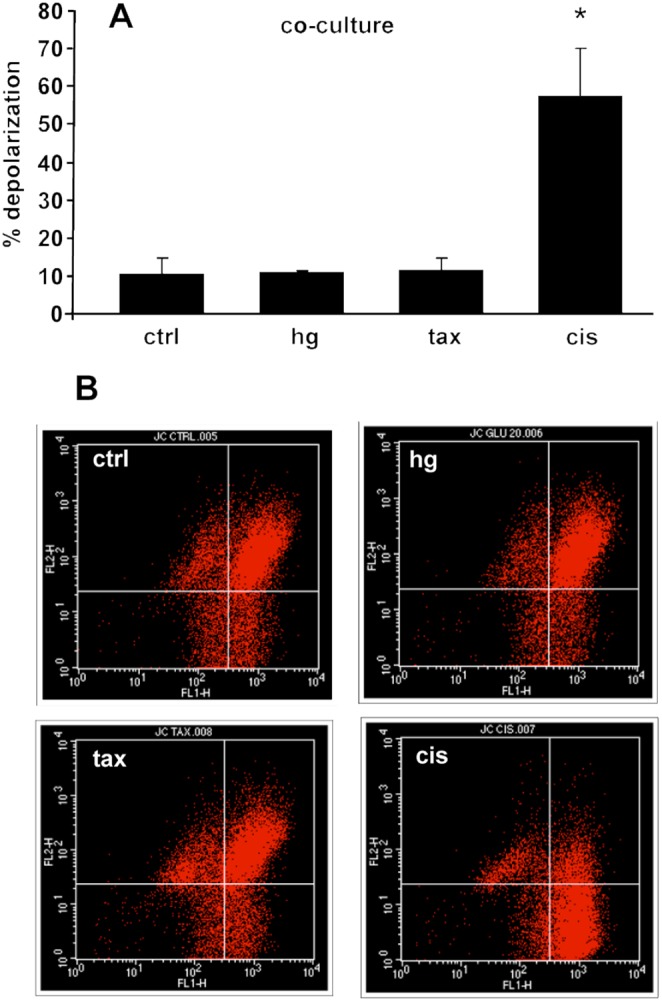
(A) JC-1 fluorescence emission measurements showed a reduction in red-to-green ratio in neurons exposed to cisplatin (cis) but not to hyperglycaemia (45 mM) nor paclitaxel (tax) (n = 4), *p<0.05 vs ctrl. (B) Representative flow cytogram of mitochondrial membrane potential in co-cultures using JC-1. The shift of JC-1 fluorescence from red (FL2) to green (FL1) indicates a collapse of mitochondrial membrane potential.