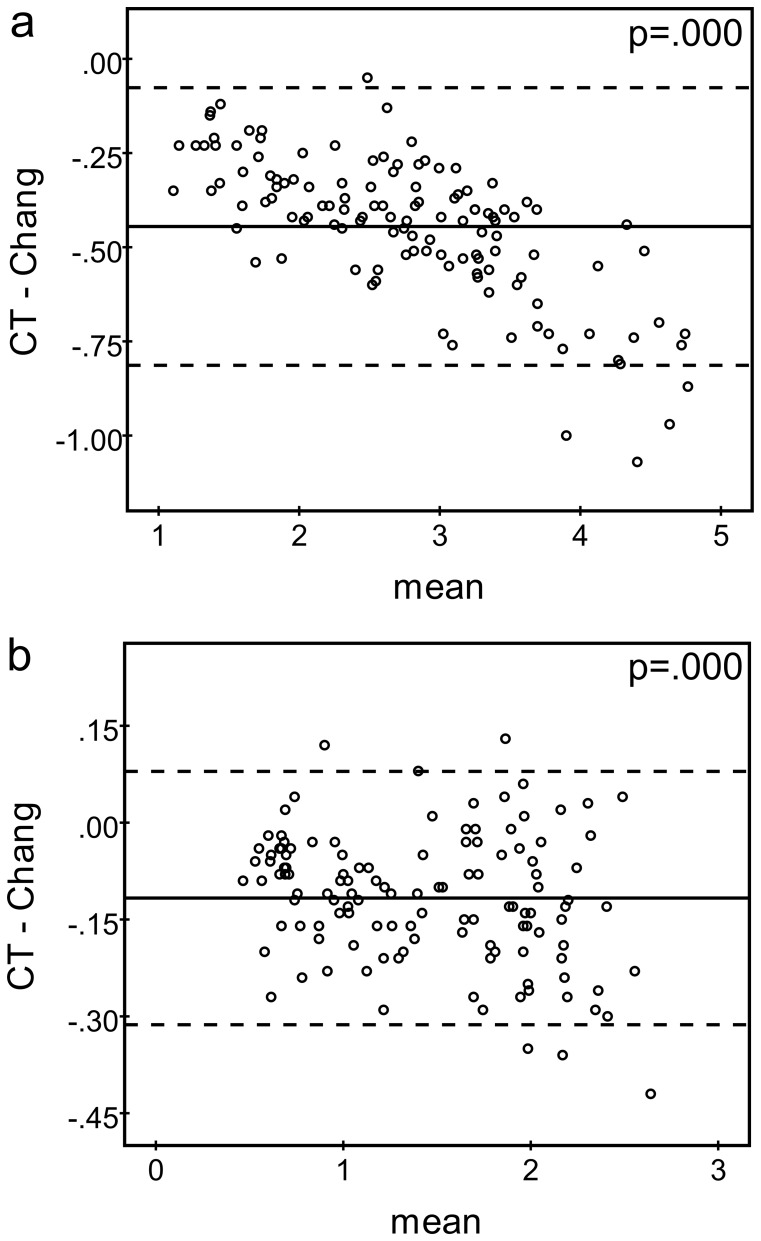
Figure 3. Bland-Altman plots comparing the SBR of the caudate (a) and the putamen (b) between CT-based and Chang AC (SBRs of both hemispheres were included independently, i.e. n = 124).
Different scales were chosen for abscissae and ordinates in a and b for display purposes. The horizontal continuous line represents the mean difference, the dashed lines indicate the 95% confidence interval. The given p-value corresponds to the one-sample t-test for zero mean.

