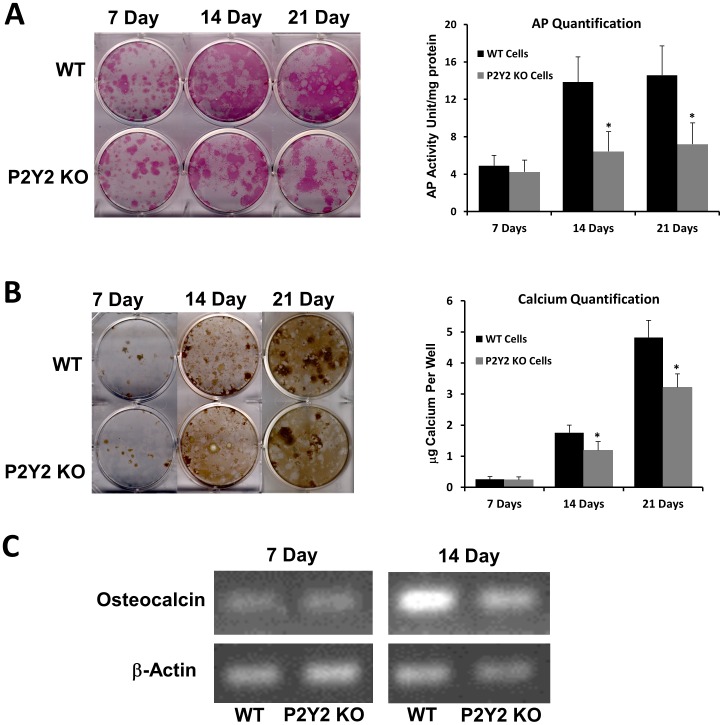
Figure 3. Differentiation (A, C) and mineralization (B) of bone marrow cells was decreased in P2Y2 KO mice.
(A) Left: Images of AP staining from bone marrow cell cultures; Right: Bar graph representation of AP quantified by colorimetric conversion of p-nitrophenol phosphate to p-nitrophenol and normalized to total protein. (B). Left: Images of von Kossa staining from bone marrow cell cultures; Right: Bar graph representation of calcium qualification by o-cresolphthalein method in each well. (C). Represented images of 35 cycles of RT-PRC show the osteocalcin mRNA levels in bone marrow cells from both WT and P2Y2 KO mice (β-actin as controls). (n = 4, *p<0.05) Error bars represent SEM.

