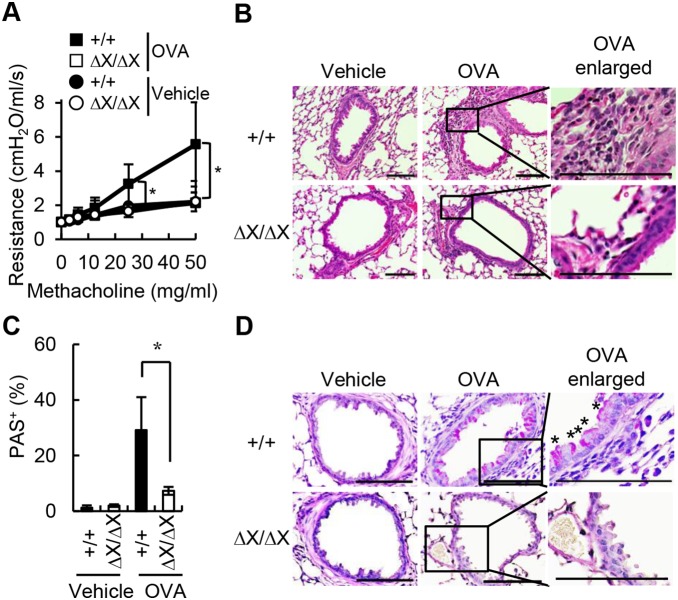
Figure 1. Attenuated asthmatic response in PLCε ΔX/ΔX mice.
(A) AHR to methacholine. AHR was assessed in OVA-sensitized PLCε +/+ (filled symbols) and PLCε ΔX/ΔX (open symbols) mice 1 day after the last challenge with the aerosol containing OVA (squares) or with vehicle alone (circles). Resistance is expressed as an increase over the baseline set at 1 cmH2O/ml/s. Data are shown as the mean ± SD obtained with 3 or 4 mice of each group. *, p<0.05 between the OVA-challenged PLCε +/+ and PLCε ΔX/ΔX mice. (B) H&E staining of airway sections. Airway sections were prepared from the OVA-sensitized mice of the indicated PLCε genotype 1 day after the last challenge either with OVA-containing aerosol or with vehicle alone as indicated. OVA enlarged show the enlargement of the boxed areas in OVA. Bars, 100 µm. (C, D) Frequency of PAS+ cells. Airway sections prepared as in (B) were subjected to PAS staining to vitalize mucus-producing cells. Nuclei were counterstained with hematoxylin. Representative sections are shown in (D), where OVA enlarged show the enlargement of the boxed areas in OVA and asterisks denote PAS+ cells. PAS+ bronchial epithelial cells and total epithelial cells were counted on the specimens prepared from 3 or 5 mice of each group, and the percentage of PAS+ epithelial cells was determined as 100×(PAS+ cell number)/(total epithelial cell number) (%). Data in (C) are expressed as the mean ± SD. *, p<0.05 between the OVA-challenged two PLCε genotypes. Bars in (D), 100 µm.

