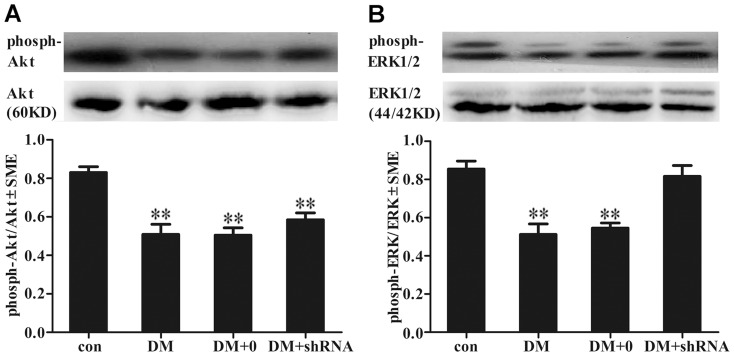
Figure 4. The expression levels of Akt and ERK1/2.
The protein levels of serine/threonine kinase (Akt) (A), extracellular signal-regulated kinase (ERK1/2) (B) were measured by Western blotting. The graphs showed the relative density of phosphorylated AKT or ERK1/2 to the total AKT or ERK1/2. The bars represented results from three independent experiments. Band intensities of phosphorylated protein were normalized to total protein. The data expressed as the mean ± SEM (n = 3). (**p<0.01 vs con) Abbreviations: con, control group; DM, diabetes mellitus group; DM +0: diabetes mellitus sham-knocked down group; DM + shRNA: diabetes mellitus GIGYF2-knocked down group.

