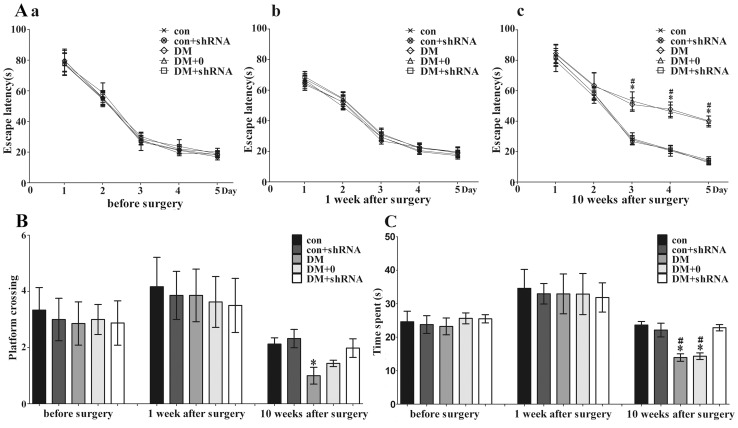
Figure 5. The results of Morris water maze (MWM) test.
Morris water maze (MWM) test was performed before intrahippocampal injection surgery, 1 week after surgery and 10 weeks after surgery in adult male mice. Learning acquisition curve showing the effects of streptozotocin and a single surgery on spatial learning (Aa, b) and the protective effects of Grb10 Interacting GYF Protein 2 (GIGYF2)-short hairpin (sh) RNA (Ac) using the mean escape time to reach the hidden platform (escape latency) over consecutive trials in the MWM task. For the probe trials, the platform crossings (B) and time spent in the target quadrant (C) was recorded. Data are expressed as the mean ± SEM (n = 12 per group). (*p<0.01 vs con; # p<0.01 vs DM + shRNA) Abbreviations: con: normal control group; DM: diabetes mellitus group; DM +0: diabetes mellitus sham-knocked down group; con + shRNA/DM + shRNA: control/diabetes mellitus GIGYF2-knockdown group.

