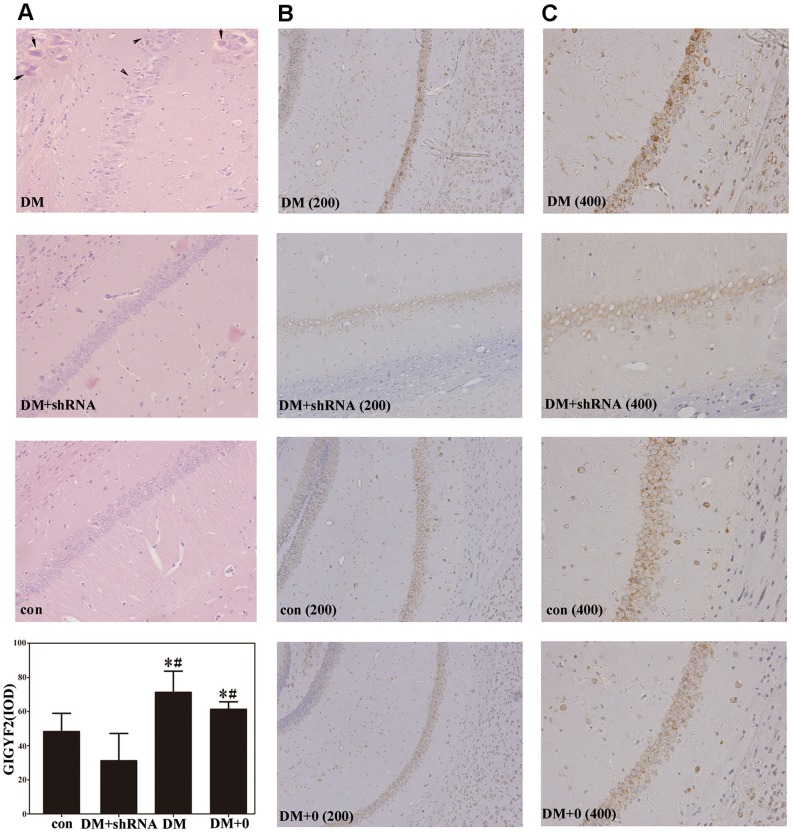
Figure 6. Haematoxylin and eosin staining (HE) of hippocampal tissue.
Arrows show senescent neurons (A, inset windows) and cell disorder arrangement (A) in the DM group compared to the healthier hippocampal neurones in the DM + shRNA group and the normal ones in the con group. Immunohistochemistry of hippocampus tissue indicated the place and expression levels of Grb10 Interacting GYF Protein 2 (GIGYF2). Integrated optical density (IOD) values were measured by Image-Pro Plus, version 6.0, and expressed as the mean ± SEM (n = 3) of two independent experiments. (*p<0.05 vs con; # p<0.05 vs DM + shRNA) Abbreviations: con: normal control group; DM: diabetes mellitus group; DM +0: diabetes mellitus sham-knocked down group; DM + shRNA: diabetes mellitus GIGYF2-knockdown group.

