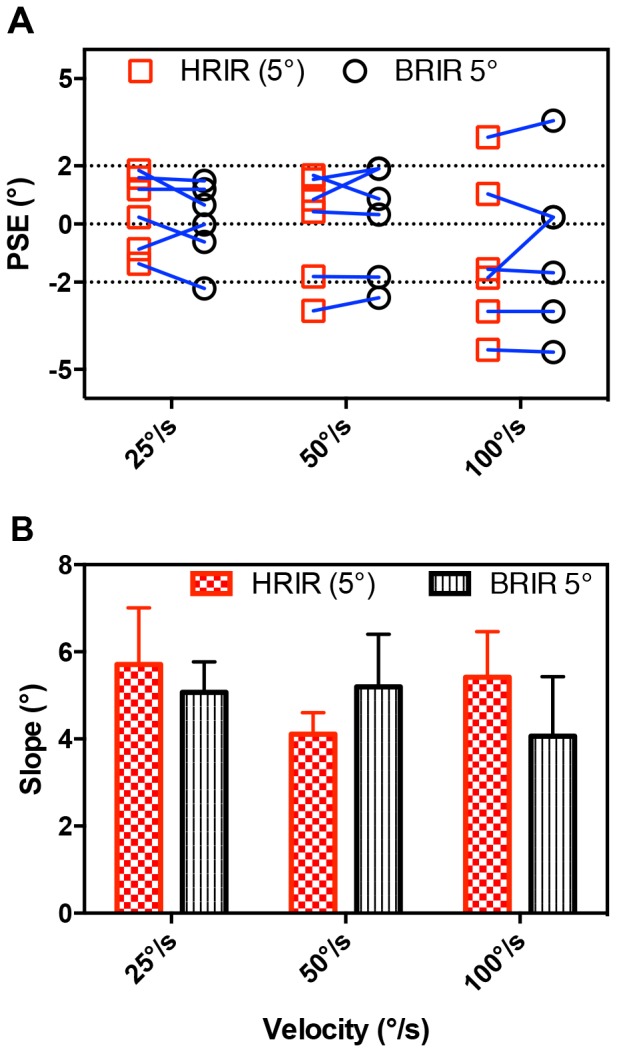
Figure 4. Results for Experiment 2.

(A) Individual PSEs from the reverberant condition (BRIRs; black circles) presented alongside the anechoic data experiment 1 (HRIRs; red squares) for all six subjects. Both auditory spaces are spatially quantized at 5° step-sizes. (B) Group mean βs. Error bars indicate between-participants standard errors.
