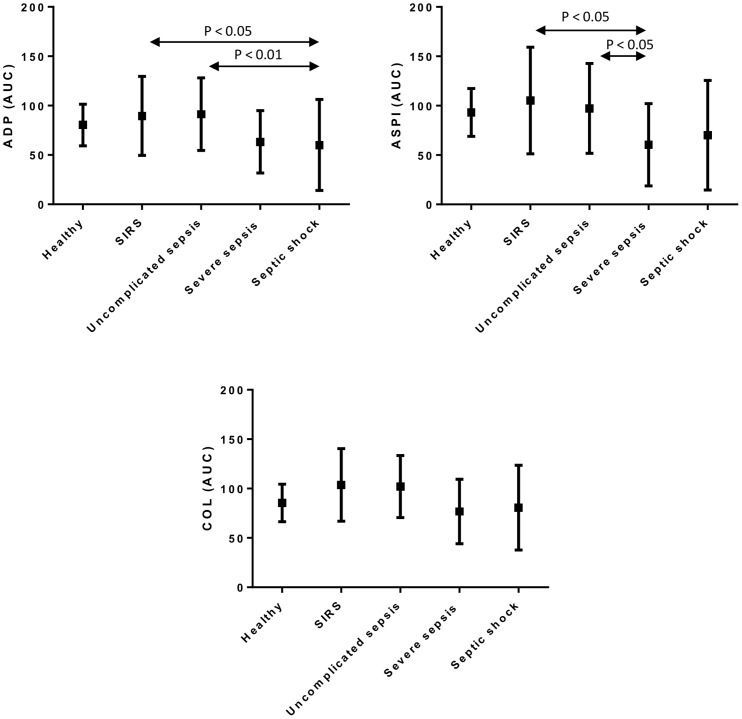
Figure 1. Comparison of platelet aggregometry measurements in different pathological groups and healthy control.
Platelet aggregation measurements induced by ADP, ASPI and Collagen agonists are shown in the different pathological groups and healthy control. Aggregometry measurements are expressed as area under the curve (AUC, arbitrary units). Significant differences between the groups are indicated by p-values, as assessed by Bonferroni post-hoc analysis.

