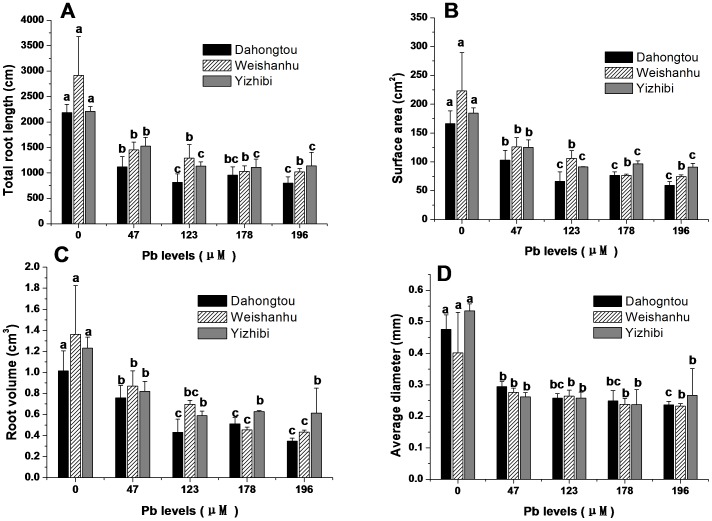
Figure 2. Root characteristics of three S. integra varieties exposed to different Pb concentrations for 14 days.
(A) Total root length. (B) Surface area. (C) Root volume. (D) Average diameter. Data points and error bars represent means ± S.D. of three replicates (n = 3). Different letters indicate significant differences (P<0.05) across the treatments according to Fisher's LSD test.

