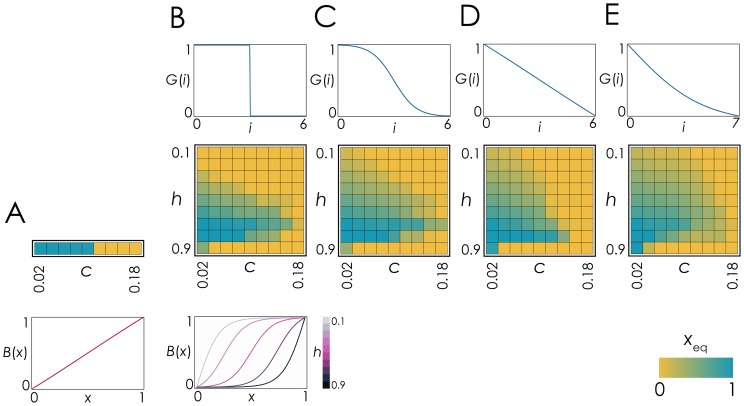
Figure 2. Different diffusion gradients allow coexistence of producers and non-producers.
For different benefit functions B(x) and gradients of diffusion G(i), the contour plots show the fraction of producers at the stable mixed equilibrium (x eq) as a function of h (the inflection point of the benefit function) and c (the cost of producing the molecule). A: Linear benefit (s = 1, h = 0.5; any of the diffusion gradients in B-E). B-E: Sigmoid benefit (s = 20). B: Fixed diffusion range with no diffusion gradient (d = 3, D = 6, z = 1000). C: Sigmoid diffusion gradient (d = 3, D = 6, z = 10). D: Linear diffusion gradient (d = 3, D = 6, z = 1). E: Convex diffusion gradient (d = 0, D = 7, z = 3).

