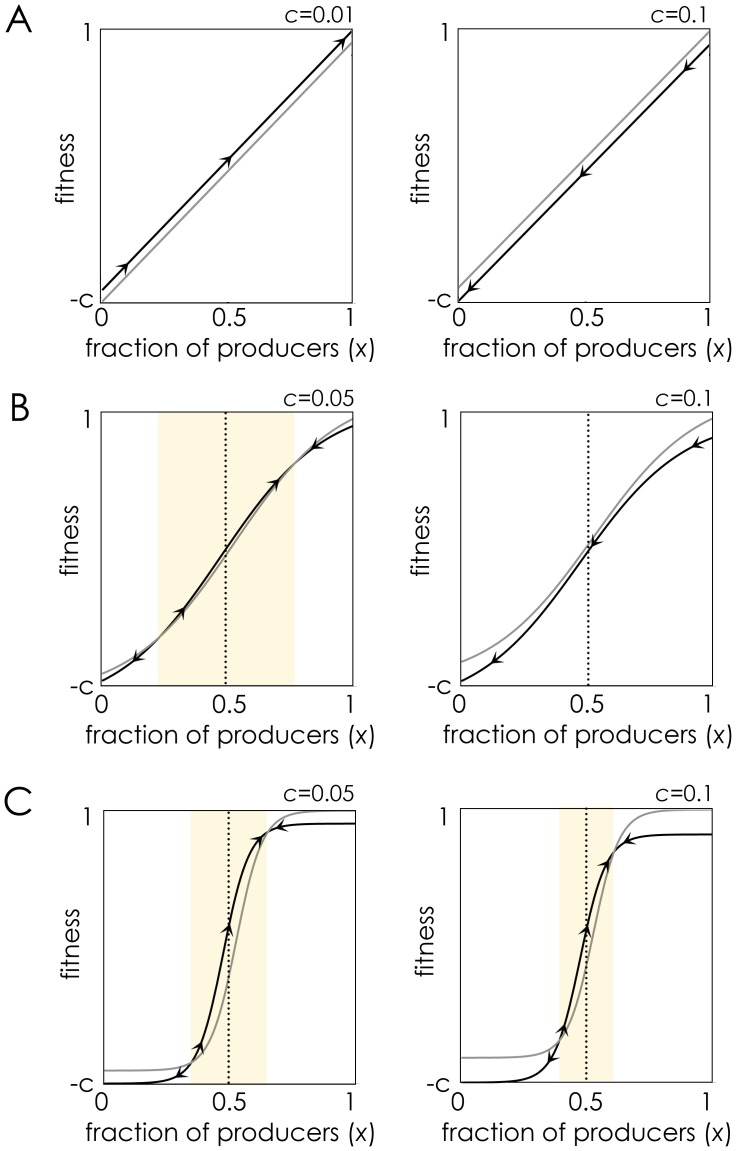
Figure 4. Why only non-linear benefits can lead to coexistence of producers and non-producers.
The fitness of producers (black curve) and non producers (grey curve) as a function of the fraction (x) of producers within the diffusion range of the molecule, for different steepness coefficients (s). The arrows show the direction of the dynamics. The shaded area shows the basin of attraction of the internal stable equilibrium (if it exists). n = 20, h = 0.5. A: The benefit B(x) of the molecule is an almost linear (s = 0.001) function of its concentration. B: The benefit B(x) is a sigmoid (s = 5) function of its concentration. C: The benefit function is essentially a step function (s = 20).

