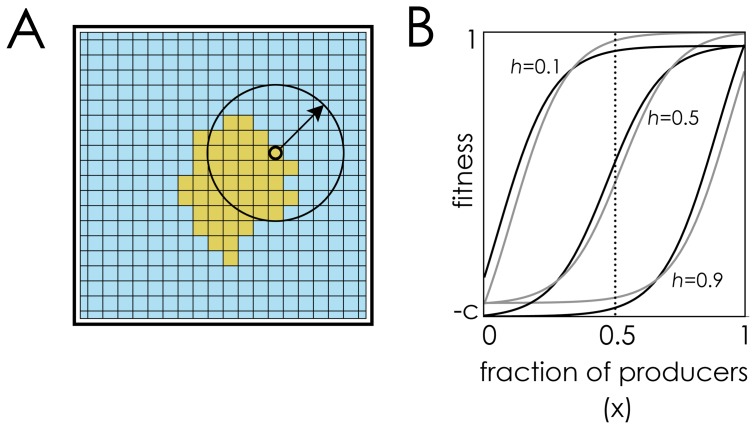
Figure 5. Why sigmoid benefits lead to different results from concave and convex benefits in spatially structured populations.
The fraction of producers within the diffusion range (shown by an arrow) of molecules produced by cells at the producer/non-producer front remains approximately constant (∼0.5) even as the front moves ahead. If the benefit function is concave (h = 0.1) or convex (h = 0.9), at this fraction of producers (∼0.5) non-producers have an advantage, whereas producers have an advantage if the benefit function is sigmoid (h = 0.5). (n = 20, c = 0.1, s = 10).

