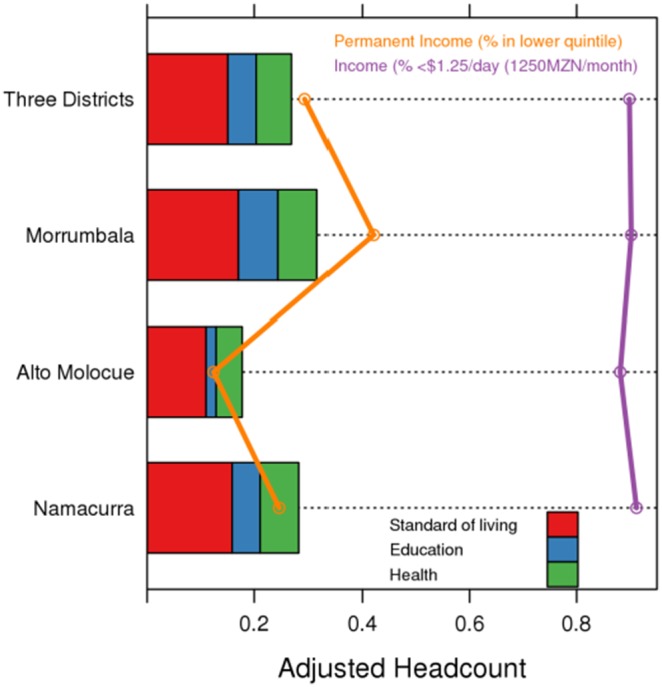
Figure 2. Decomposition by District and Broken Down by Dimension in the Three Focal Districts, Ogumaniha 2010. Legend:

The adjusted headcount is decomposed by dimension for Morrumbala, Alto Molócuè, Namacurra and all three districts combined. Data that are overlaid include percent of households in the lowest quintile for permanent income wealth and % of households making less than USD$1.25/day. MZN = Metical.
