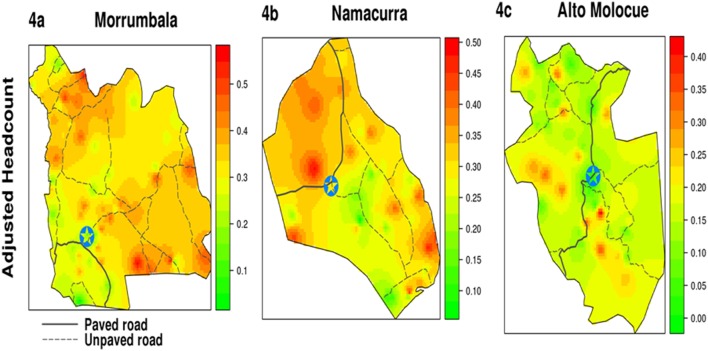
Figure 4. Smoothed Heat Map of Three Focus Districts: Morrumbala, Namacurra, and Alto Molócuè.
*Figures 4a, 4b, and 4c show heat map geographical representations of poverty by adjusted headcount with green being less deprived and red most deprived. (Circled Star represents location of district capital).

