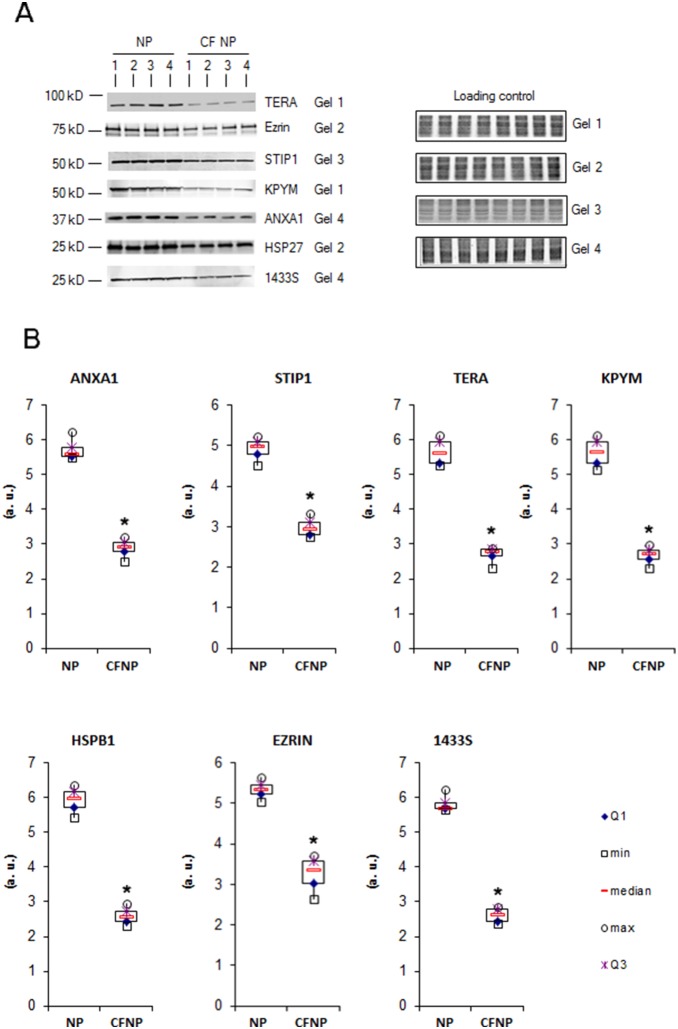
Figure 4. Western blot analysis of seven differentially expressed proteins.
The Western blots from the 4 NP patients and the 4 CFNP patients used for proteomic experiments are shown with their respective loading controls. A: Each protein is analyzed in three technical replicates. For normalization, the acrylamide gels were stained with Coomassie blue (total migrated protein detection) just after electro-transfer and scanned using the Odyssey LI-COR. Using the Odyssey software, protein intensity values were normalized with their corresponding loading control intensity values. B: Box plots of the intensity calculated with the Odyssey software, *p<0.01, Mann and Whitney test. (a.u.: arbitrary units). We report Maximum (max), minimum (min), first quartile (Q1), third quartile (Q3).

