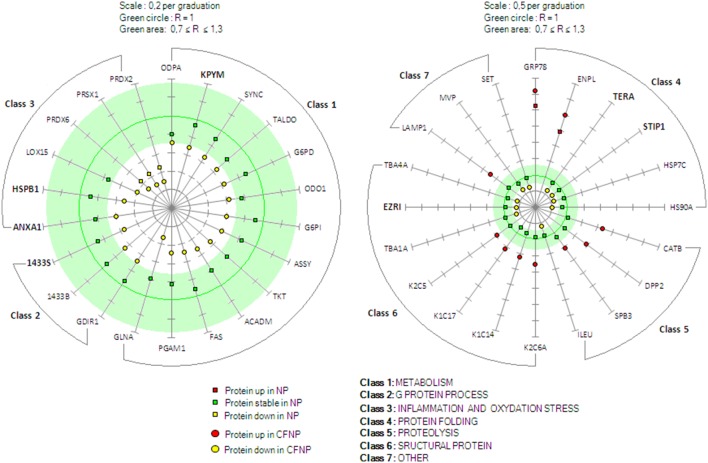
Figure 6. Expression pattern of the 42 differential proteins of interest in CF.
The 42 differential proteins are displayed in seven different classes related to their functions (according to the AmiGO toolbox kit). Left graph: metabolism (class 1), G protein process (class 2), inflammation and oxidative stress (class 3); right graph): protein folding (class 4), proteolysis (class 5), structural protein (class 6), other (class 7). The green circle represent the absolute stable ratio value (R = 1) and the green area represent the ratio thresholds (0.73≤R≤1.37) (R = CFNP/CTRL or NP/CTRL). Scale graduations for R are 0.2 and 0.5 for left and right graph, respectively. The CFNP/CTRL ratio values of the differential proteins are represented by yellow dots (downregulated in CFNP) and red dots (upregulated in CFNP); the NP/CTRL ratio values are represented by yellow squares (downregulated in NP), red squares (upregulated in NP), and green squares (stable in NP). For the proteins in bold, the modulation was confirmed by Western blot. Protein names are from Swissprot, ratio values and p values are available in supplemental material (Table S1).

