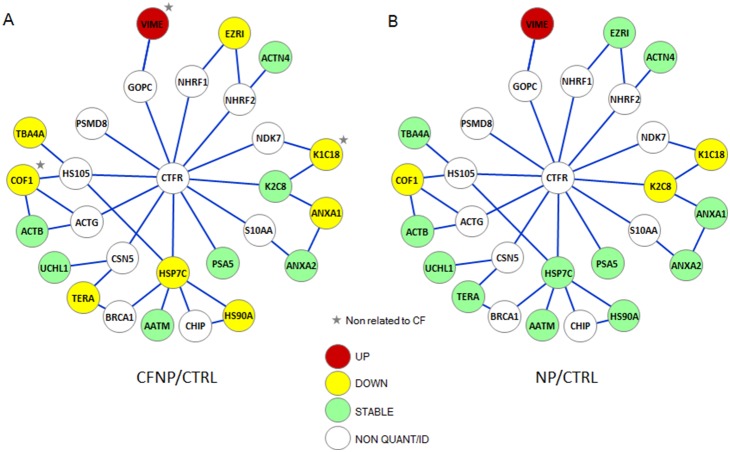
Figure 8. Quantified proteins present in the CFTR physical network.
Proteomics quantitative analysis allowed us to reproducibly quantify 186 proteins. Of those, 16 could be mapped on a hand curated CFTR physical network based on the Biogrid interaction database (http://thebiogrid.org).This network is composed of 198 proteins selected according to experimental criteria for direct protein-protein interactions (surface plasmon resonance (SPR), pull-down and FRET experiments). To this bibliographic network, we have added proteins identified in our laboratory using SPR and DNA ligation assays. We built the CFTR protein interaction network by taking into account only proteins that directly interact with one another, at first and second degrees. In the graph, we represent the 16 proteins with a color code corresponding to their expression status in CF (A) and NP (B) compared to CTRL: upregulated (red), downregulated (yellow), stable (green). The network is completed by a minimal number of connecting proteins of the CFTR network (white) that could not be identified or quantified by MS/MS. Proteins that are up or downregulated in both CFNP and NP are marked by a grey star.

