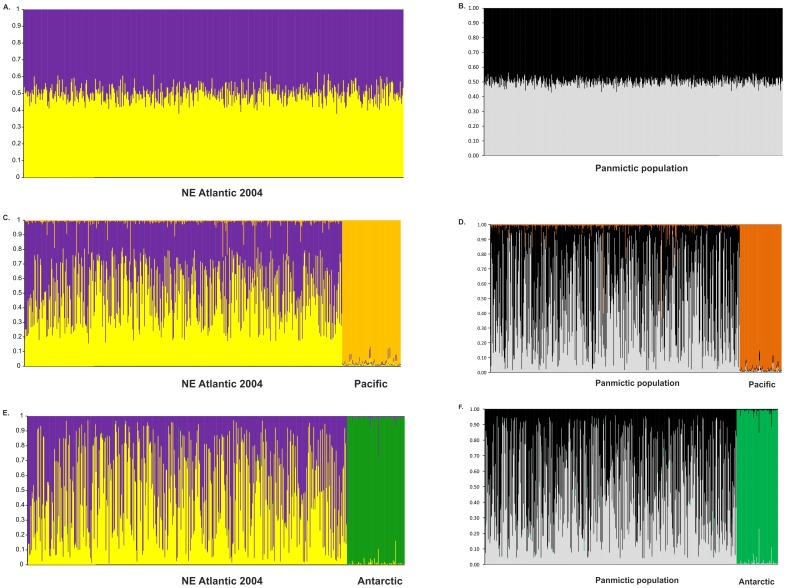
Figure 3. Example of comparison between real populations and the simulated panmictic ones.
Bayesian clustering of North East Atlantic minke whale corresponding to year class 2004 (left column) and to a randomly chosen simulated panmictic population (right column). Inferred ancestry of individuals was calculated after averaging ten STRUCTURE runs with CLUMPP for K = 2 (barplots a,b) and K = 3 (barplots c–f). The outgroups were 95 individuals of the Pacific subspecies (B. a. scammoni) and 93 individuals of the Antarctic species (B. bonaerensis).

