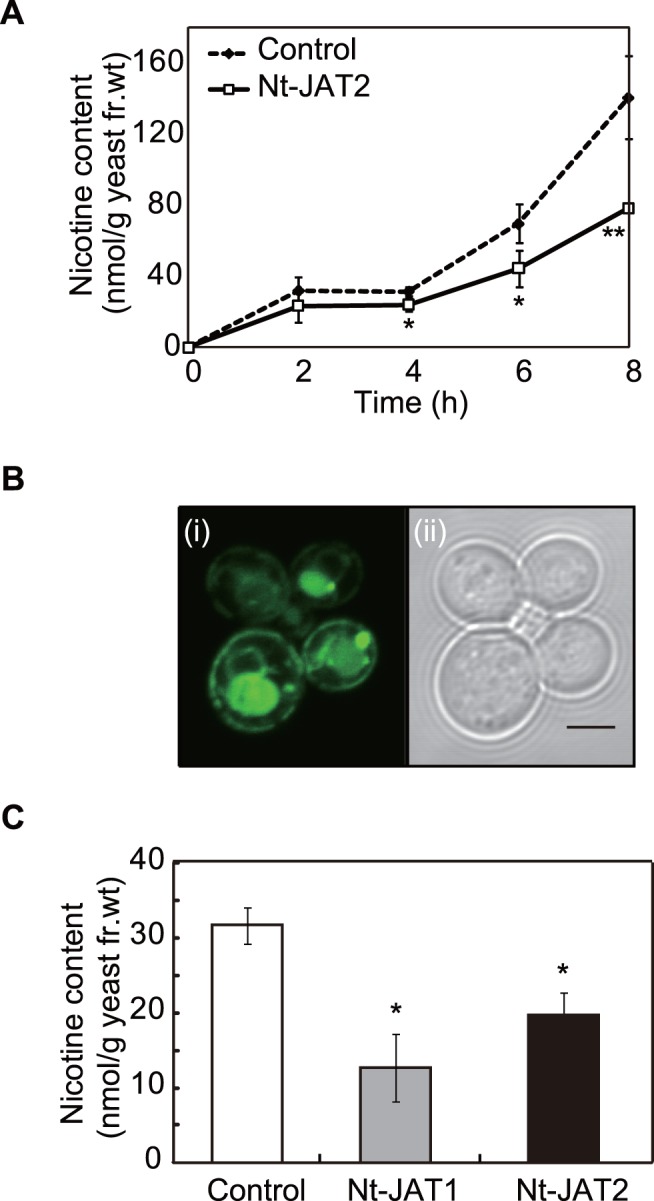
Figure 4. Nicotine transport activity of Nt-JAT2.

(A) Time course analysis of nicotine transport in Nt-JAT2-expressing yeast. Control (dashed line) and Nt-JAT2-expressing (solid line) yeast cells were incubated in half-strength SD medium supplemented with 1 mM nicotine and sampled at the times indicated. Results are mean ± SD of triplicates. *P<0.05; **P<0.01 compared with control by Student’s t-test. (B) Localization of Nt-JAT2–GFP in yeast cells. Yeast cells expressing Nt-JAT2–GFP were grown at 30°C to logarithmic growth phase and observed by fluorescence microscopy. (i) Fluorescence of yeast cells transformed with Nt-JAT2–GFP; (ii) bright-field contrast (scale bar, 5 µm). (C) Nicotine content in control (white bar), Nt-JAT1-expressing (gray bar) and Nt-JAT2 -expressing (black bar) yeast cells incubated in half-strength SD medium containing 0.5 mM nicotine for 6 h. Results are mean ± SD of triplicates. *P<0.01 compared with control by Student’s t-test.
