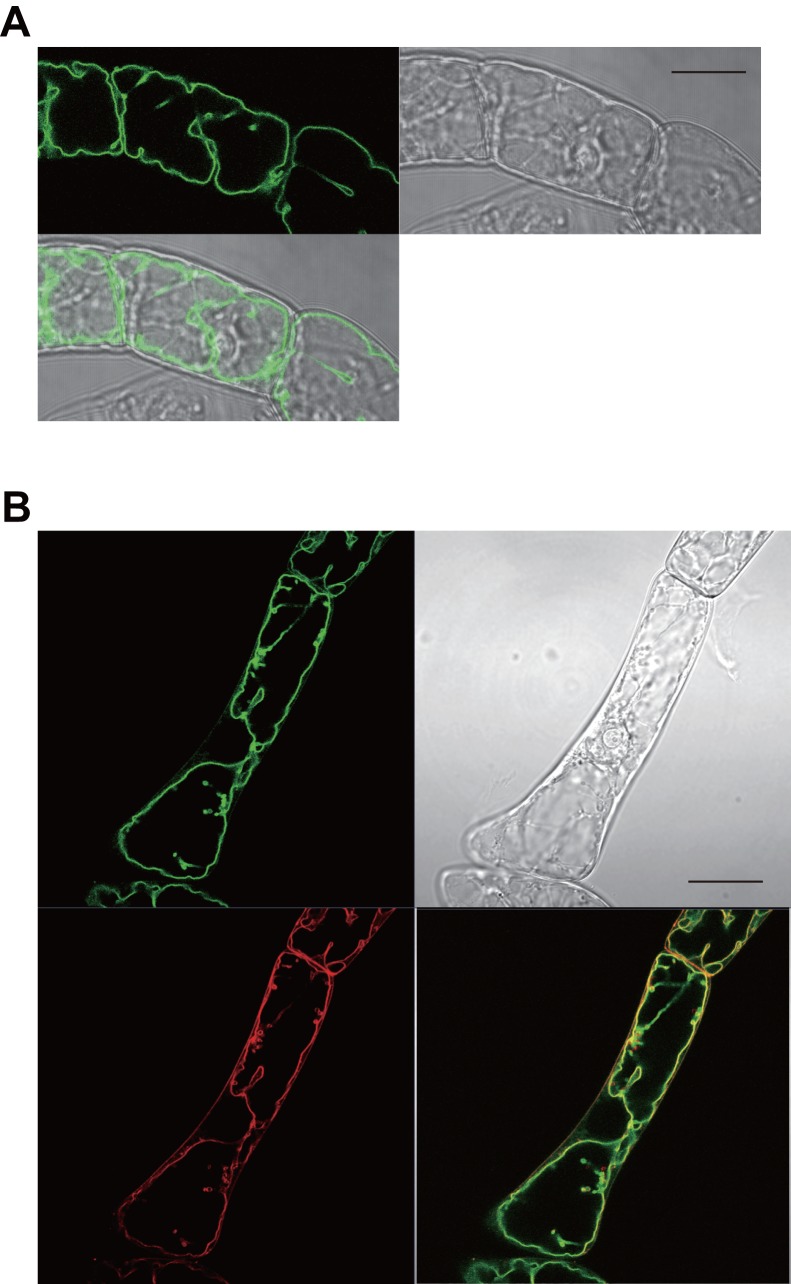
Figure 6. Subcellular localization of Nt-JAT2 in cultured tobacco cells.
(A) Confocal images of Nt-JAT2-GFP in transgenic BY-2 cells. (left) Nt-JAT2-GFP fluorescence images, (right) bright field images, (bottom left) merged images. (B) Nt-JAT2-GFP fluorescence (green, top left), FM4-64 fluorescence (red, bottom left), merged (bottom right), and bright field (top right) images after treatment for 24 h (scale bar, 2 µm.).

