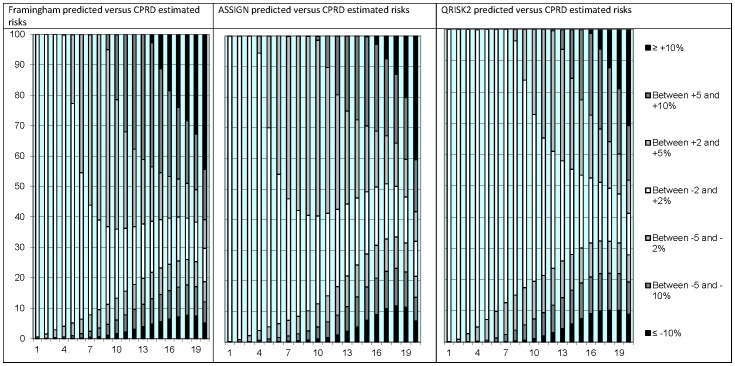
Figure 1. Absolute differences in individual 10-year CVD risk prediction between the Framingham, ASSIGN and QRISK2 risk scores and the individual risks estimated in CPRD using competing risk regression stratified by vigintiles of predicted risk.
X-axis: Vigintiles of predicted risk. Y-axis: Percentage of persons.

