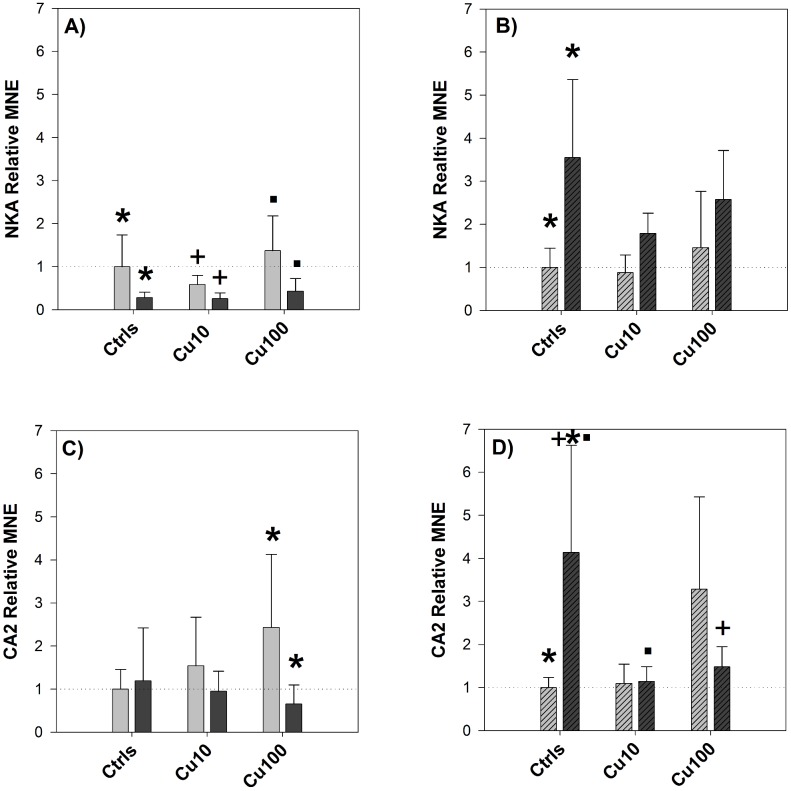
Figure 3. Pre-post change in NKA and CA2 expression – Exp.1.
Relative Mean Normalized Expression (MNE) levels of NKA (graphs A and B), and CA2 (graphs C and D) measured in the gills (A and C) and in the mid-anterior tract of the intestine (B and D, striped bars) of sheepshead minnows exposed to 0 (Ctrls), 10 and 100 µg/L copper. Within each copper treatment, the pair of bars represents expression levels before (left side) and after (right side) the salinity transition. Relative MNE levels were determined by qPCR, normalized to control gene (18S) and expressed as fold change relative to pre-switch control value, which was set at 1 (dotted horizontal line). Values are means ± SE (n = 6/7). In each graph, bars sharing the same symbol (asterisk, cross or dot) are significantly different one from the other (P<0.05, Tukey t-test).

