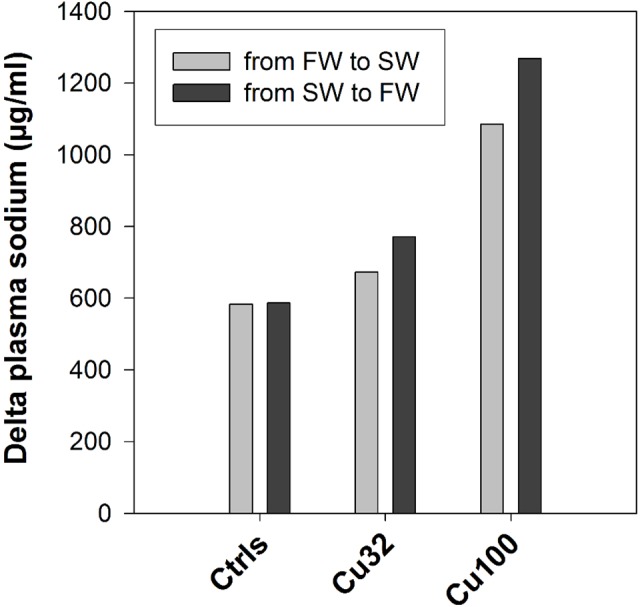
Figure 6. Degree of change in sodium levels.

Difference (delta) in plasma sodium levels (µg/ml) before and after the salinity transition in fish exposed to 0 (Ctrls), 32 and 100 µg/L copper. Light grey and dark grey bars represent the delta change in the transition respectively from FW to SW and from SW to FW. No values are reported for the high-copper group as no fish survived after the salinity change. Values are calculated as difference between means and as such have no SE.
