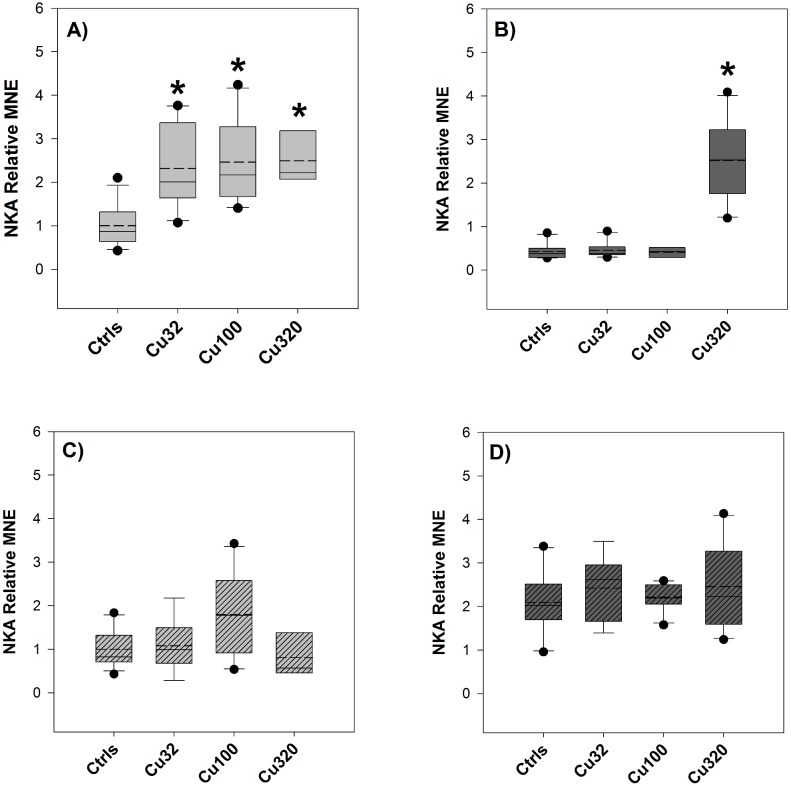
Figure 7. NKA expression – Exp.2.
Relative Mean Normalized Expression (MNE) levels of NKA measured in the gills (A and B) and in the mid-anterior tract of the intestine (C and D, striped bars) of sheepshead minnows exposed to 0 (Ctrls), 32, 100 and 320 µg/L copper for 19 days. Light grey boxes (graphs A and C) and dark grey boxes (B and D) represent NKA levels respectively in FW and SW groups. Relative MNE levels were determined by qPCR, normalized to control gene (18S) and expressed as fold change relative to FW control value, which was set at 1. Values are means ± SE (n = 10/12, except for the FW Cu320 group, where n = 6). The asterisk denotes statistically significant difference from the control value (P<0.05, Tukey t-test). Solid horizontal lines represent median values and dashed lines represent mean values.

