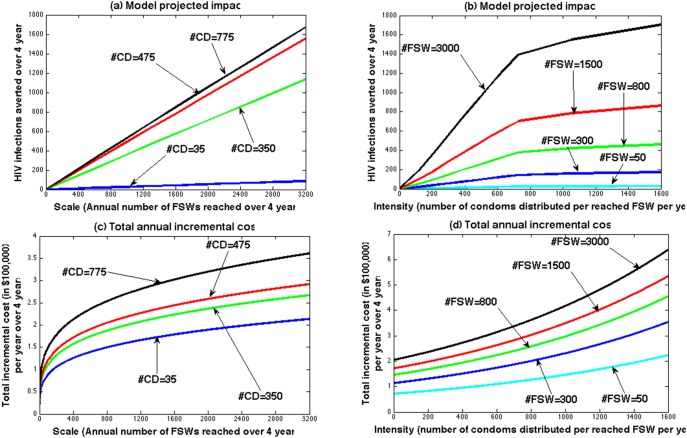
Figure 2. The relationship between total intervention impact and annual cost (in $100,000 per year) over 4 years (2004–2007) and intervention scale (Annual number of FSWs reached by the intervention over 4 years - #FSW) (a and c) or intervention intensity (annual number of condoms distributed per reached FSW over 4 years - #CD) (b and d).
Impact is projected by the model (described in main text and Appendix S1) and total cost is estimated by the cost function TC = scaleae 10.18+b*intensity (a = 0.256, b = 0.00071 as per equation (1) of Appendix S3).

