
Figure 4. The cost-effectiveness of different modelled intervention combinations that avert 300, 600 or 900 HIV infections between 2004 and 2007 for different levels of scale (average annual number of FSWs reached by the intervention over 4 years) and intensity (average annual number of condoms distributed per reached FSW over 4 years).
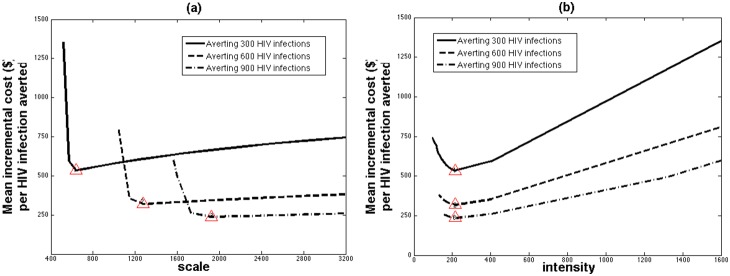
The optimal intervention for averting 300, 600 and 900 HIV infections is the minima of each curve (the red numbered triangles on each curve; with respective cost-effectiveness of $2136, $1279 and $947 per HIV infection averted) when respective scale is 636, 1278 and 1926 FSWs reached per year and average intensity is #CD = 216. The red triangles in the figures refer to these optimal (scale, cost-effectiveness) (in (a)) and (intensity, cost-effectiveness) (in (b)) combinations.