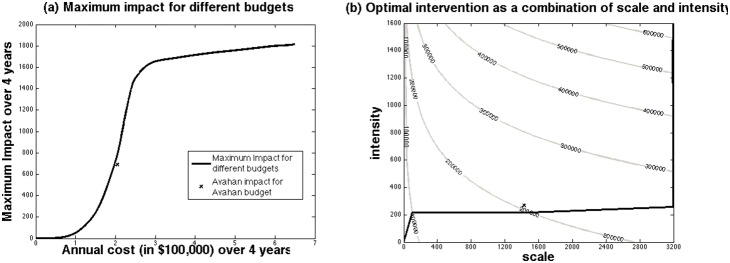
Figure 5. The relationship between incremental annual cost and impact over 4 years (a) or scale and intensity (b) for the optimal intervention strategies that maximise impact for different budget levels.

In (a) we projected the maximum intervention impact, as the number of HIV infections averted, for different budget levels between 2004 and 2007. In (b) we show the optimal combination of scale (average number of FSWs reached each year between 2004 and 2007) and intensity (average number of condoms distributed per FSWs per year: #CD) to attain this maximum intervention impact, with contours of constant annual cost over 4 years also shown for reference. The cross in (a) signifies the estimated cost and impact of Avahan in the representative district, whereas in (b) it signifies the average scale and intensity of Avahan in the representative district.
