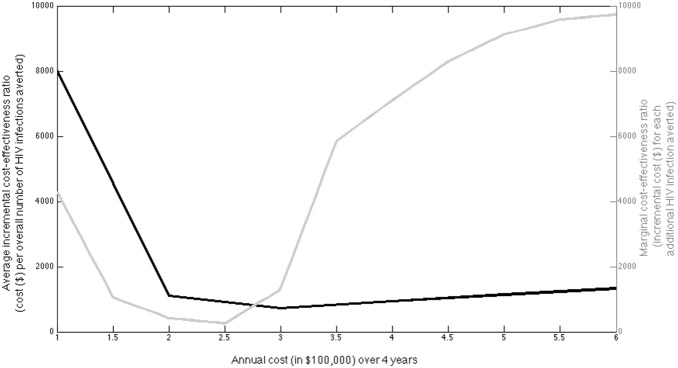
Figure 6. Illustration of the relationship between yearly budget levels (averaged over 4 years of intervention period (2004–2007)) and both the average incremental cost-effectiveness ratio (ICER = cost/impact; dark-grey curve) and the marginal cost-effectiveness ratio (MCER = Δcost/Δimpact; light-grey curve) for each additional HIV infection averted when the optimal intervention combination is adhered to in the typical/representative district.

