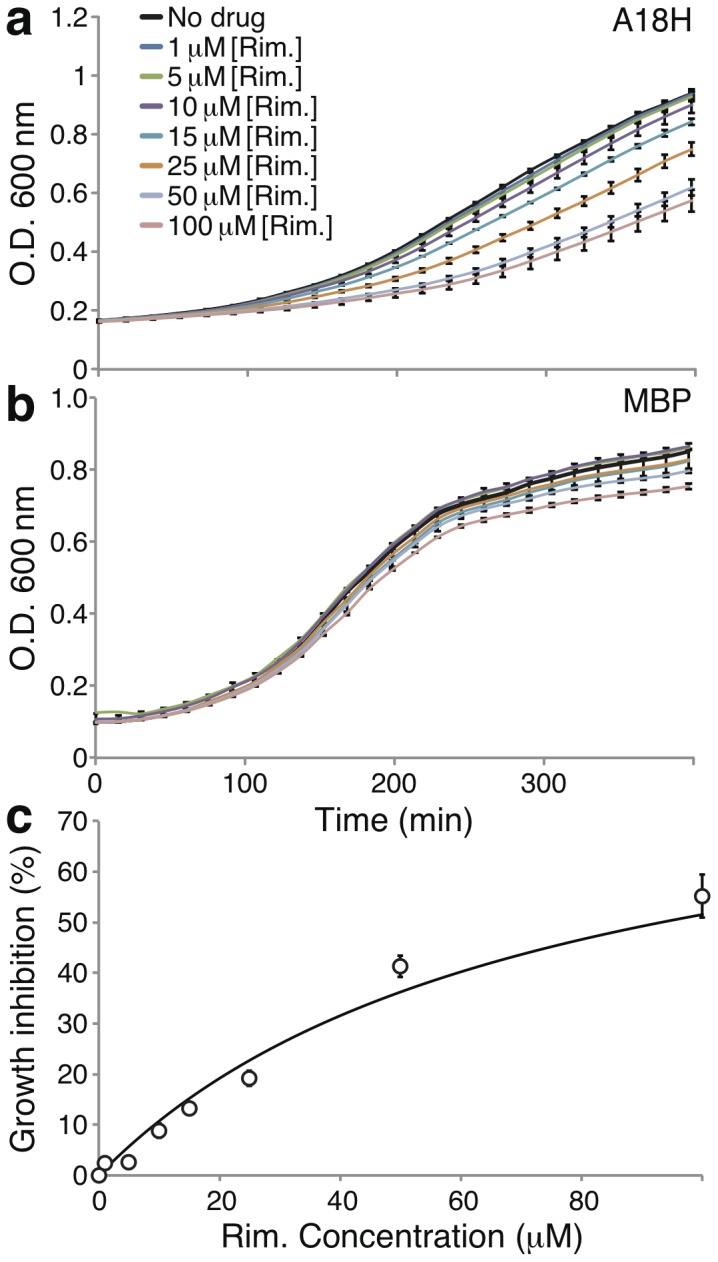
Figure 8. Impact of rimantadine on bacterial growth.

a. Growth curves of LB650 bacteria expressing mutant H18A Vpu as a function of different rimantadine concentrations. No K+ was added to the growth media. b. Growth curves of LB650 bacteria expressing MBP without a channel fused to it (as a control), as a function of different rimantadine concentrations. K+ was added to the growth media to final concentration of 87 mM. c. Fitting of the data in panel a according to the Monod equation (solid line), to the experimental data shown above (circles).
