
Figure 5.
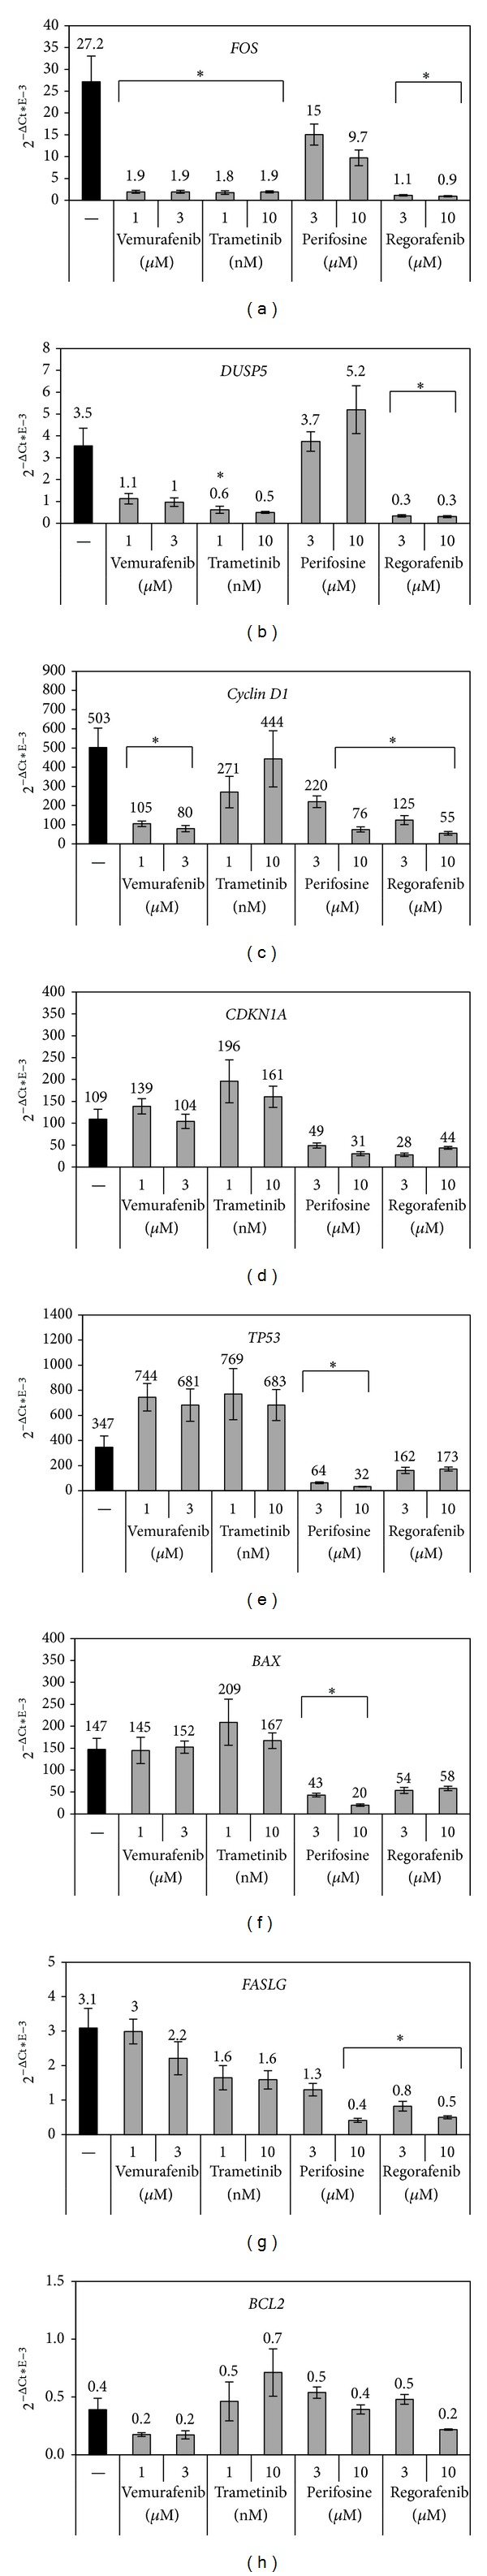
Gene expression profiles of SMI-treated HROC24 cells. Cultured HROC24 cells were exposed to SMI at the indicated concentrations for 6 hours. The mRNA expression of (a) FOS, (b) DUSP5, (c) cyclin D1, (d) CDKN1A, (e) TP53, (f) BAX, (g) FASLG, and (h) BCL2 and the housekeeping gene HPRT was analyzed by real-time PCR and relative amounts of target mRNA were calculated as described in the “materials and methods” section. Data of n = 4–8 independent cultures were used to calculate mean values ± SEM. *P < 0.006 versus control cultures with Bonferroni-adjusted α = 0.00625.