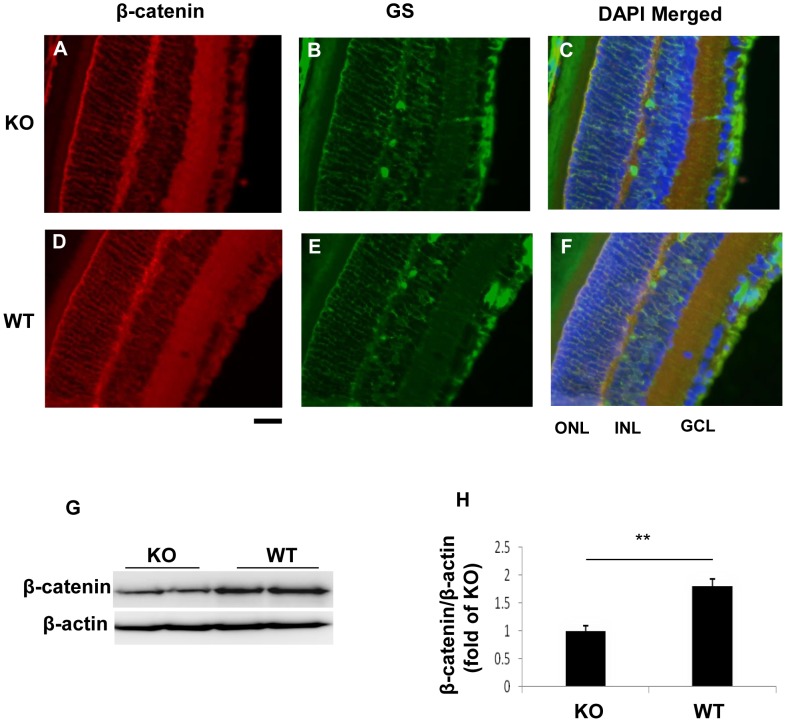
Figure 2. Decreased β-catenin levels in the retinas of the diabetic and OIR KO mice.
(A–H) Immunostaining of β-catenin (red) and GS (green) in the retina of the diabetic β-catenin KO mice (A–C) and WT mice (D–F), with the nuclei counterstained with DAPI (blue). Scale bar: 50 µm. ONL, outer nuclear layer; INL, inner nuclear layer; GCL, ganglion cell layer. (G, H) Western blot analysis of β-catenin in the retina of OIR mice at P17 (G) and quantification by densitometry (H). Values are mean±SEM; n = 6; **p<0.01.

