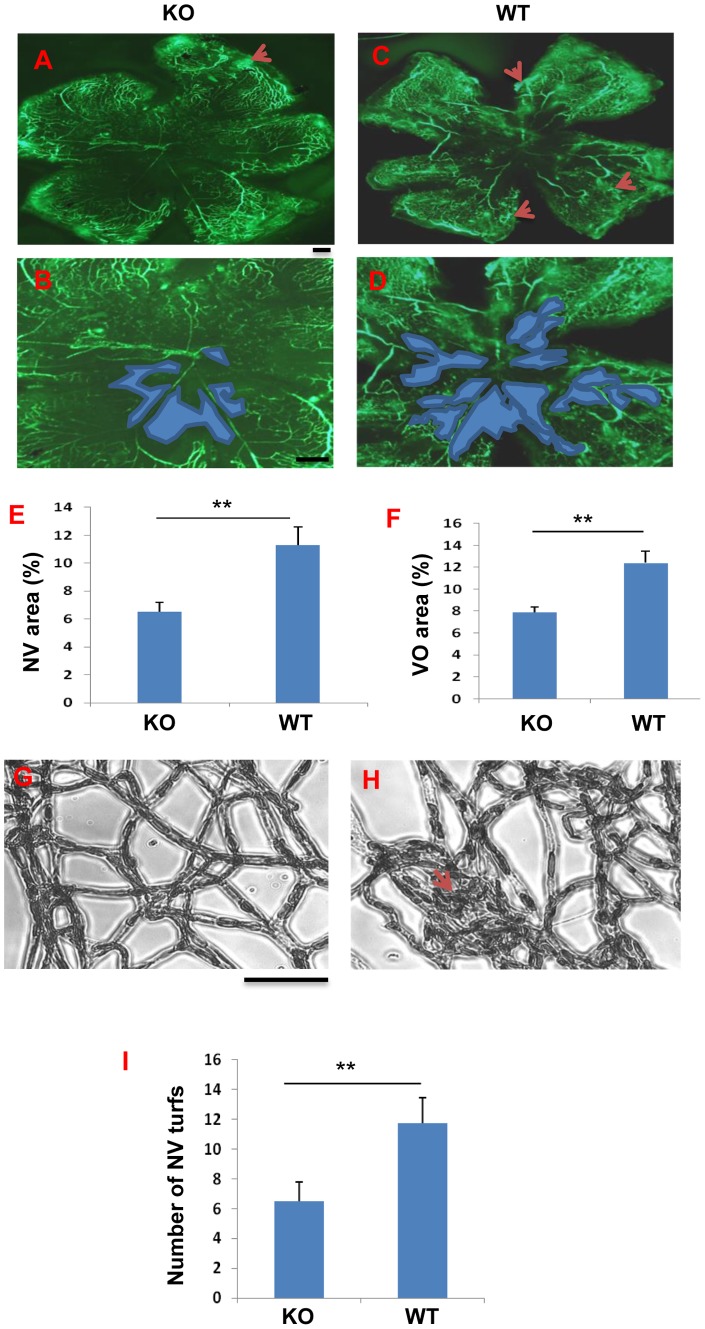
Figure 4. Amelioration of ischemia-induced retinal NV in the β-catenin KO mice with OIR.
(A–E) Representative fluorescein angiographs of the β-catenin KO (KO) (A, B) and WT (C, D) mice at age P17. Red arrows in A and C indicate NV areas. Blue areas in (B, D) indicate vaso-obliteration (VO) regions in the central retina that was used in the quantification. (E) Quantification of the retinal NV area in fluorescein angiographs (n = 10). (F) Quantification of the VO area (n = 10). (G, H) Visualization of NV turfs by retina trypsin digest assay. Scale bar, 50 µm. (I) Quantification of retinal NV turfs in the retina with trypsin digest. All values are mean±SEM (n = 5, **p<0.01).

