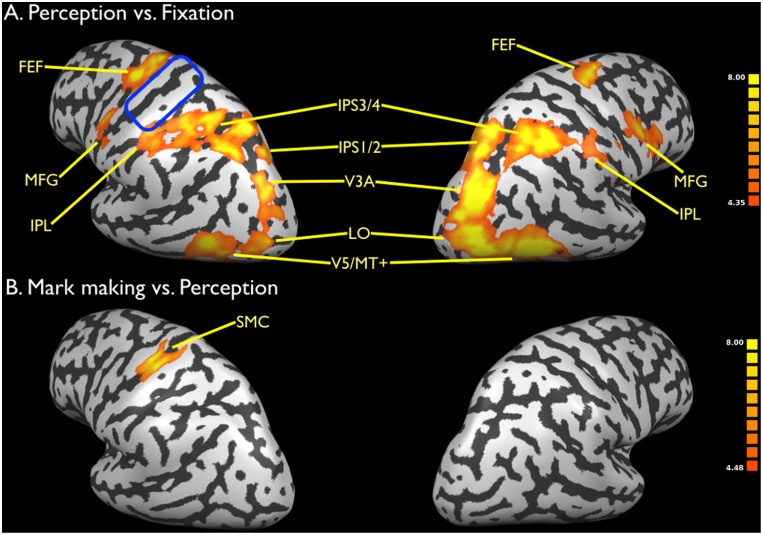
Figure 5. Brain activations for motion perception.
a) Perception vs. fixation. b) Mark making vs. perception. Data are corrected for multiple comparisons using FDR p<0.01. The blue oval in panel a indicates the region of the sensorimotor cortex for copying not activated in motion perception. See legend to Figure 2 for abbreviations.

