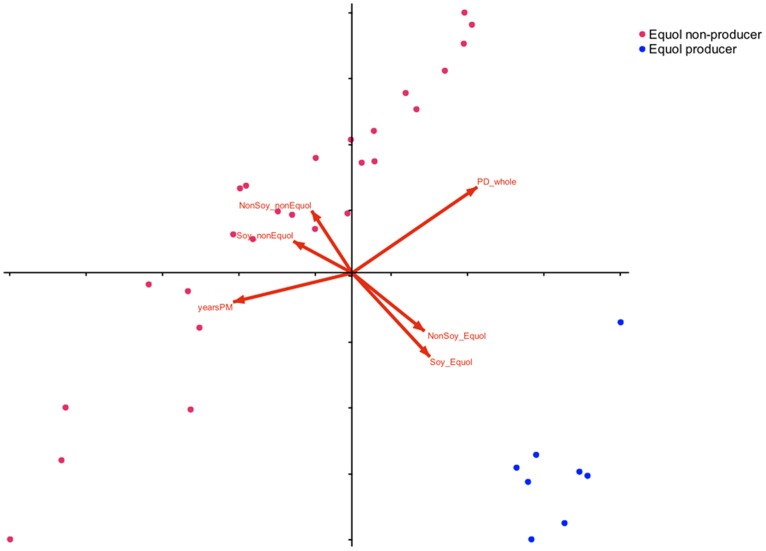
Figure 3. Canonical correspondence analysis of fecal bacterial composition and alpha diversity measures and postmenopausal women metrics.
Non-S-(-)equol producers are represented by green dots, and red dots represent S-(-)equol producers. Arrows represent the direction of the host factors significantly corresponding to bacterial community composition. Host factors depicted are equol producers, non-S-(-)equol producers, with no soy in diet, after soy intervention, years post-menopause and alpha diversity (illustrated PD whole tree phylogenetic diversity but Chao1 and Shannon have the same trajectory). Variation explained in horizontal axis is 8.2% and the vertical axis is 6.9%.

