
Figure 2.
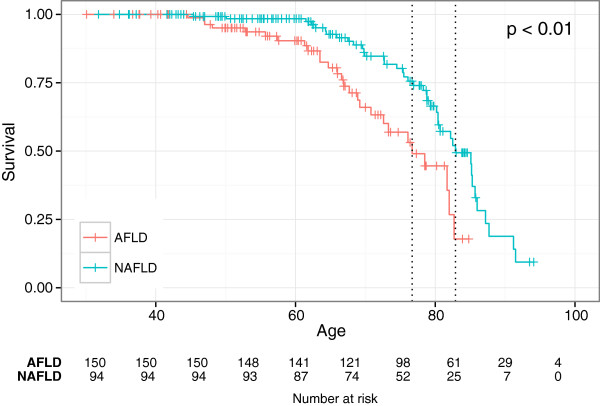
Kaplan Meier survival plots showing survival from day of birth after correcting for age, gender and year of diagnosis for the NAFLD- and AFLD groups. The green line showing the NAFLD (non-alcoholic fatty liver disease) group and the red line showing the AFLD (alcoholic fatty liver disease) group.