
Figure 4.
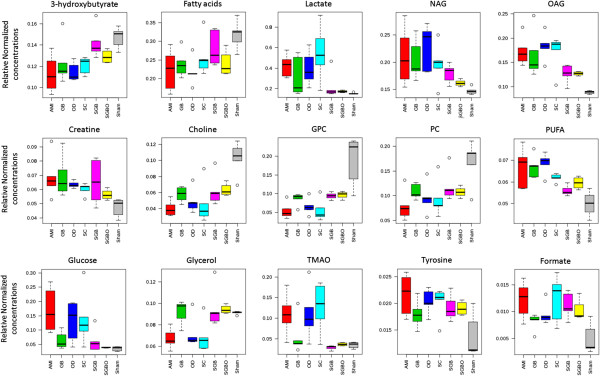
Relative Normalized concentrations of the significantly changed metabolites. Red, green, blue, light blue, pink, yellow and grey bar charts represent relative normalized concentrations in the AMI, GB, OD, SC, SGB, SGBO and sham group, respectively. NAG, N-acetyl-glycoprotein; OAG, O-acetyl-glycoprotein; GPC, glycerophosphocholine; PC, phosphocholine; TMAO, trimethylamineoxide; PUFA, polyunsaturated lipids.