
Figure 2.
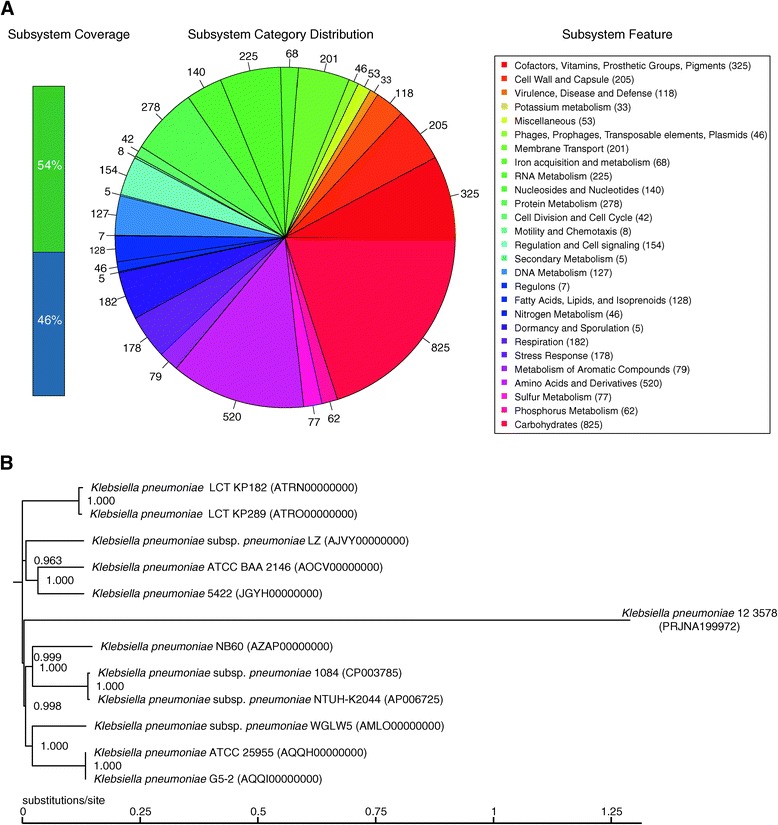
Subsystem distribution and phylogenetic analysis. A. Distribution of genes assigned to SEED subsystems (based on the RAST annotation server). B. Phylogenetic relationships (based on WGS and SNPs) of 12 K. pneumoniae strains and their genomic distance analysis. The snpTree server output used assembled genomes as input data.